Published
🔥 What is the best BBQ city in America? 🔥
Austin, Texas, is the best city for BBQ in the U.S. Austin has 4.7 BBQ restaurants per 100,000 people, double the national average (2.3 per 100,000).
Ranking 50 BBQ Cities | Top 15 Cities for BBQ | Honorable Mentions | Rankings by Category | 10 Worst BBQ Cities | Methodology | FAQ
Cooking up BBQ is as popular today as it’s ever been, with 4 in 5 U.S. homeowners owning a grill or smoker.
Although best associated with the South, BBQ cuisine has found broad appeal throughout the country. In fact, mac and cheese, brisket, and pulled pork are among Americans’ 20 favorite foods, according to 2023 polling from YouGov.
But which U.S. cities are the best for BBQ food? To find out, Real Estate Witch analyzed a variety of metrics from Yelp, Google, U.S. Census data, food truck data from Roaming Hunger, and other sources.
Here’s how the metrics were weighted to compile our list of the 50 best BBQ cities.
- 6x: BBQ restaurants per capita
- 6x: Google Trends score for 12 BBQ terms, such as “barbecue,” “BBQ,” “BBQ near me,” “BBQ restaurant,” “brisket,” “pulled pork,” and “how to BBQ”
- 5x: BBQ food trucks per capita
- 4x: Regional price for 1 pound of BBQ meat — poultry, beef, and pork averaged together
- 4x: Percentage of local annual income required to buy 4 pounds of BBQ meat per month in a year (about 1 pound per week)
- 3x: Average Yelp rating of local BBQ restaurants
- 2x: Major BBQ events scheduled for remainder of 2023 (in a 50-mile radius)
- 1x: BBQ restaurants per square mile
Whether you’re a certified pitmaster or a BBQ newbie, continue reading to see if your city’s BBQ scene is on fire — or getting smoked by the competition.
🐄 Best BBQ Cities Statistics
- Austin, Texas, is the best BBQ city in the country. It has 4.7 BBQ restaurants per 100,000 people, with an average of 4.22 stars on Yelp. Jump to section 👇
- Riverside, California, is the worst city for BBQ, with high prices and just 0.71 BBQ restaurants per 100,000 people. 👇
- Texas is the best state for BBQ, with three cities in the top 15: Austin, San Antonio, and Houston. 👇
- California is the worst state for BBQ, with four Golden State cities placing in the bottom 10: Riverside, San Francisco, San Diego, and Los Angeles. 👇
- Las Vegas has the most BBQ restaurants per capita of any city in the country, with 5.9 per 100,000 people — nearly 2.5x more than the average city we analyzed (2.3 per 100,000). 👇
- Miami has the fewest BBQ restaurants per capita at just 0.66 per 100,000 people.
- Raleigh, North Carolina, has the most BBQ trucks per capita of any city — 2.0 per 100,000 people — nearly 3x the average city (0.7 per 100,000). 👇
- St. Louis is the best BBQ city in Missouri, with better Yelp ratings and higher Google search activity for BBQ than Kansas City.
- St. Louis scored a perfect 100 in our BBQ passion metric, based on Google search activity for BBQ-related terms. 👇
- Washington, D.C., is the most affordable city for BBQ lovers. Based on the typical local income, buying a pound of BBQ meat every week for a year would cost a resident 0.21% of their annual income — compared to 0.34% in the average city. 👇
State of the BBQ Union: Ranking 50 Cities for BBQ
Texas is the best state for BBQ, with three cities in the top 15. Other states that had multiple cities in the top 15 include Tennessee, Missouri, and Florida.
BBQ Cities: By the Numbers
| 2023 Overall BBQ City Rank | City | BBQ Restaurants per 100,000 People | Average Yelp Rating | Average Cost for 1 Pound of BBQ Meats | % of Income Spent on BBQ Meats* | BBQ Trucks per 100,000 People | BBQ Passion Score (Google Trends)** | Remaining BBQ Events in 2023 | BBQ Restaurants per Square Mile | 2022 Overall BBQ City Rank |
|---|---|---|---|---|---|---|---|---|---|---|
| - | National Average | 2.29 | 3.92 | $5.32 | 0.30% | 0.74 | 69.4 | 0.34 | 0.02 | - |
| 1 | Austin, TX | 4.68 | 4.22 | $5.29 | 0.31% | 1.66 | 91.0 | 1 | 0.02 | 2 |
| 2 | Memphis, TN | 3.37 | 3.76 | $5.29 | 0.45% | 1.12 | 97.3 | 1 | 0.01 | 11 |
| 3 | San Antonio, TX | 4.50 | 4.07 | $5.29 | 0.38% | 1.11 | 89.8 | 0 | 0.02 | 1 |
| 4 | Birmingham, AL | 4.04 | 3.69 | $5.29 | 0.42% | 1.08 | 98.5 | 0 | 0.01 | 6 |
| 5 | Las Vegas, NV | 5.89 | 4.27 | $5.86 | 0.44% | 0.87 | 80.1 | 0 | 0.05 | 5 |
| 6 | Nashville, TN | 3.77 | 4.01 | $5.29 | 0.35% | 1.19 | 78.8 | 0 | 0.01 | 4 |
| 7 | Houston, TX | 1.42 | 4.13 | $5.29 | 0.36% | 0.76 | 96.7 | 3 | 0.01 | 18 |
| 8 | Oklahoma City, OK | 3.12 | 3.60 | $5.29 | 0.41% | 1.53 | 67.5 | 0 | 0.01 | 8 |
| 9 | Jacksonville, FL | 3.36 | 3.79 | $5.29 | 0.37% | 1.10 | 77.1 | 0 | 0.02 | 9 |
| 10 | Raleigh, NC | 2.35 | 3.54 | $5.29 | 0.30% | 2.00 | 71.3 | 0 | 0.01 | 14 |
| 11 | St. Louis, MO | 1.92 | 4.09 | $5.29 | 0.36% | 0.78 | 100.0 | 1 | 0.02 | 26 |
| 12 | New Orleans, LA | 3.17 | 3.93 | $5.29 | 0.45% | 0.55 | 81.7 | 0 | 0.01 | 33 |
| 13 | Buffalo, NY | 2.67 | 4.08 | $4.72 | 0.36% | 0.69 | 59.6 | 0 | 0.005 | 37 |
| 14 | Kansas City, MO | 2.46 | 3.97 | $5.29 | 0.34% | 0.86 | 85.6 | 0 | 0.01 | 10 |
| 15 | Tampa, FL | 1.77 | 4.21 | $5.29 | 0.40% | 0.68 | 71.5 | 1 | 0.04 | 7 |
| 16 | Dallas, TX | 1.13 | 3.97 | $5.29 | 0.33% | 0.64 | 96.7 | 2 | 0.003 | 12 |
| 17 | Orlando, FL | 3.19 | 4.09 | $5.29 | 0.39% | 0.82 | 60.7 | 0 | 0.01 | 13 |
| 18 | Atlanta, GA | 1.59 | 3.93 | $5.29 | 0.36% | 0.78 | 96.2 | 2 | 0.01 | 19 |
| 19 | Richmond, VA | 2.73 | 4.00 | $5.29 | 0.34% | 1.06 | 59.8 | 0 | 0.02 | 15 |
| 20 | Cleveland, OH | 1.49 | 3.37 | $5.29 | 0.45% | 0.82 | 88.3 | 0 | 0.002 | 42 |
| 21 | Louisville, KY | 3.81 | 3.98 | $5.29 | 0.40% | 0.54 | 55.9 | 0 | 0.01 | 16 |
| 22 | San Jose, CA | 5.53 | 3.90 | $5.86 | 0.24% | 0.87 | 62.0 | 0 | 0.03 | 3 |
| 23 | Baltimore, MD | 2.01 | 3.95 | $4.72 | 0.27% | 0.42 | 53.2 | 2 | 0.01 | 34 |
| 24 | Pittsburgh, PA | 1.66 | 3.81 | $4.72 | 0.34% | 0.76 | 54.7 | 0 | 0.02 | 48 |
| 25 | Philadelphia, PA | 1.24 | 3.90 | $4.72 | 0.28% | 0.55 | 72.8 | 0 | 0.02 | 46 |
| 26 | Portland, OR | 3.11 | 4.16 | $5.86 | 0.34% | 0.84 | 74.0 | 1 | 0.01 | 28 |
| 27 | Columbus, OH | 2.00 | 4.07 | $5.29 | 0.35% | 1.12 | 53.7 | 0 | 0.01 | 38 |
| 28 | Milwaukee, WI | 2.62 | 3.72 | $5.29 | 0.37% | 0.89 | 55.0 | 0 | 0.01 | 40 |
| 29 | Denver, CO | 2.35 | 4.09 | $5.86 | 0.31% | 1.18 | 78.2 | 0 | 0.03 | 32 |
| 30 | Indianapolis, IN | 2.02 | 3.72 | $5.29 | 0.36% | 0.85 | 57.2 | 0 | 0.01 | 24 |
| 31 | Cincinnati, OH | 2.17 | 3.92 | $5.29 | 0.36% | 0.80 | 55.0 | 0 | 0.01 | 25 |
| 32 | Washington, DC | 1.23 | 4.02 | $4.72 | 0.21% | 0.42 | 57.8 | 1 | 0.02 | 17 |
| 33 | Sacramento, CA | 2.45 | 4.03 | $5.86 | 0.33% | 0.50 | 83.4 | 0 | 0.04 | 23 |
| 34 | New York, NY | 1.26 | 4.12 | $4.72 | 0.27% | 0.06 | 58.9 | 0 | 0.03 | 41 |
| 35 | Charlotte, NC | 1.37 | 3.92 | $5.29 | 0.36% | 0.63 | 59.8 | 0 | 0.01 | 21 |
| 36 | Detroit, MI | 1.33 | 3.32 | $5.29 | 0.38% | 0.44 | 70.0 | 0 | 0.01 | 45 |
| 37 | Chicago, IL | 1.26 | 3.99 | $5.29 | 0.32% | 0.27 | 77.5 | 0 | 0.01 | 29 |
| 38 | Providence, RI | 1.19 | 3.85 | $4.72 | 0.31% | 0.54 | 39.9 | 0 | 0.01 | 49 |
| 39 | Minneapolis, MN | 1.17 | 3.84 | $5.29 | 0.29% | 0.76 | 54.8 | 1 | 0.01 | 44 |
| 40 | Virginia Beach, VA | 1.00 | 4.06 | $5.29 | 0.35% | 0.50 | 65.4 | 0 | 0.01 | 20 |
| 41 | Hartford, CT | 1.32 | 3.88 | $4.72 | 0.28% | 0.50 | 41.9 | 0 | 0.003 | 39 |
| 42 | Los Angeles, CA | 1.97 | 4.28 | $5.86 | 0.34% | 0.45 | 71.7 | 0 | 0.03 | 27 |
| 43 | Boston, MA | 1.20 | 3.59 | $4.72 | 0.22% | 0.27 | 51.0 | 0 | 0.01 | 47 |
| 44 | Salt Lake City, UT | 2.53 | 3.69 | $5.86 | 0.35% | 0.48 | 61.4 | 0 | 0.02 | 36 |
| 45 | Phoenix, AZ | 0.95 | 3.83 | $5.86 | 0.37% | 0.69 | 74.6 | 0 | 0.01 | 50 |
| 46 | Seattle, WA | 1.40 | 3.92 | $5.86 | 0.28% | 0.57 | 74.6 | 1 | 0.01 | 43 |
| 47 | Miami, FL | 0.66 | 3.91 | $5.29 | 0.40% | 0.36 | 44.1 | 0 | 0.01 | 35 |
| 48 | San Diego, CA | 2.34 | 3.95 | $5.86 | 0.31% | 0.33 | 58.3 | 0 | 0.02 | 22 |
| 49 | San Francisco, CA | 2.21 | 3.99 | $5.86 | 0.24% | 0.24 | 62.0 | 0 | 0.02 | 30 |
| 50 | Riverside, CA | 0.71 | 3.76 | $5.86 | 0.34% | 0.15 | 71.7 | 0 | 0.01 | 31 |
The 15 Best BBQ Cities, Ranked
1. Austin, Texas
🍖 BBQ Capital of the U.S.
Austin is the country’s best city for BBQ. The city has 4.7 BBQ restaurants per 100,000 people — more than double the national average of 2.3 per 100,000.
Austin may be part of the Lone Star State, but its BBQ is closer to a five-star product. The city’s BBQ restaurants average 4.22 stars on Yelp — the third-best rating of the 50 cities we analyzed.
Moving up from No. 2 in our 2022 ranking, it’s safe to say Austin’s BBQ scene is on a roll. In fact, the city has 1.7 BBQ food trucks per 100,000 people — the second most in the country behind Raleigh (2.0 per 100,000), according to data from Roaming Hunger.
It’s no surprise that Austin residents are often looking up BBQ foods and restaurants online. The city scored a 91 out of 100 on our Google Trends metric, based on search activity for BBQ-related terms.
» Notable BBQ in Austin: Terry Black’s BBQ and Franklin Barbecue
2. Memphis, Tennessee
🔥 Tenn out of Tenn BBQ
“Blues City” has nothing to be sad about when it comes to BBQ. Memphis climbed to No. 2 in our ranking this year, up from No. 11 in 2022, cementing its claim as the best BBQ city in Tennessee.
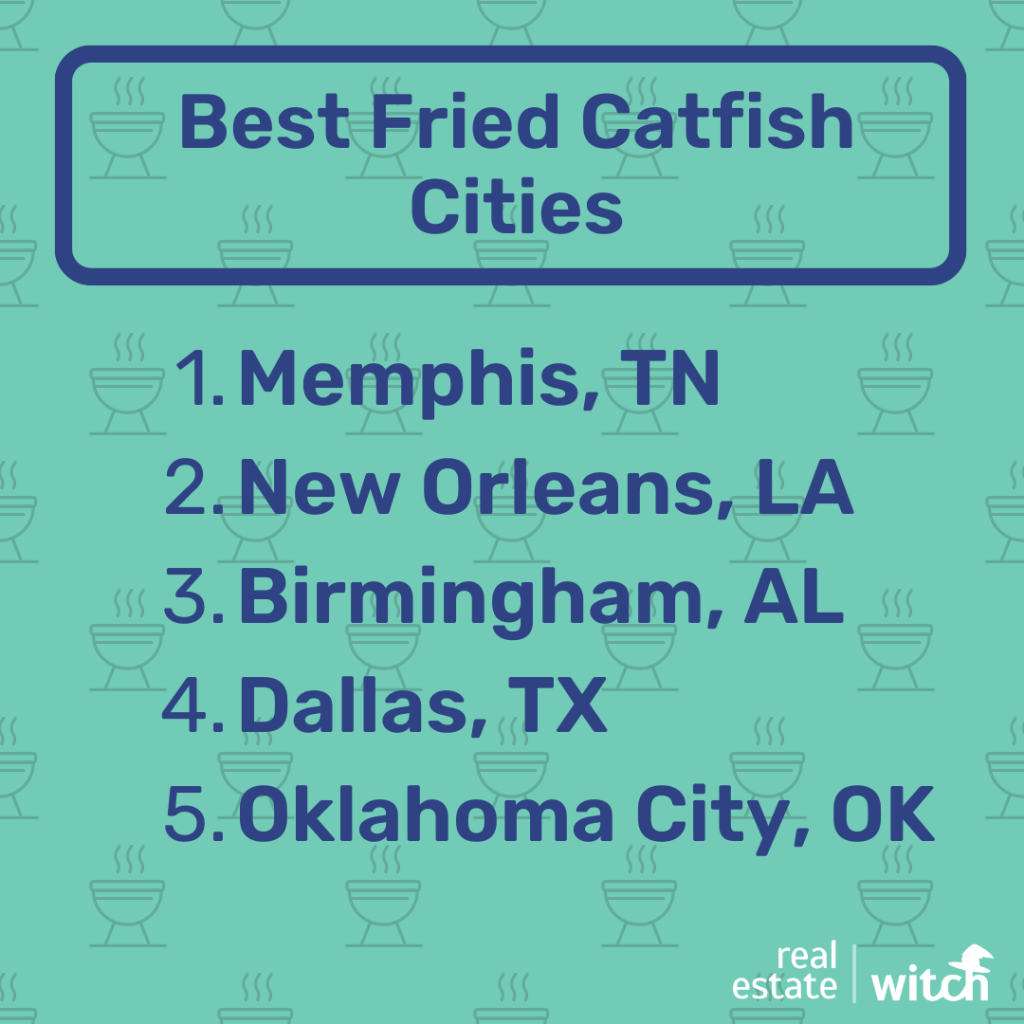
This Mississippi River city has BBQ passion flowing in its veins. That passion is evidenced by its high internet search activity for BBQ. Memphis scored a 97 out of 100 in our Google Trends metric, based on searches for 12 popular BBQ-related terms. Specifically, it ranks No. 1 for search interest in “fried catfish.”
Memphis residents have plenty of options when it comes to grabbing grub, with 3.4 BBQ restaurants per 100,000 people — 43% more than the average city (2.3 per 100,000). The city also has 1.1 BBQ food trucks per 100,000 people — 57% more than the average city (0.7 per 100,000).
Plus, firing up the smoker at home is affordable in Memphis. BBQ meats cost an average of $5.29 per pound, cheaper than the average price in our study of $5.32.
» Notable BBQ in Memphis: The Bar-B-Q Shop and Cozy Corner BBQ
3. San Antonio, Texas
✋ Lend a Yelping Hand
San Antonio BBQ restaurants average 4.07 stars on Yelp — better than the national average of 3.92 stars.
Although San Antonio slipped out of the No. 1 spot from our 2022 ranking, the city still boasts a blazing BBQ scene.
San Antonio has 4.5 BBQ restaurants per 100,000 people — about double the national average of 2.3 per 100,000 people. It also offers plenty of BBQ on the go, with 1.1 BBQ food trucks per 100,000 people — 57% more than the average city we ranked (0.7 per 100,000).
San Antonio also shows a measurable passion for BBQ, scoring a 90 out of 100 in our Google Trends metric, based on search activity for various BBQ-related terms. That includes ranking No. 1 in search interest for “brisket.”
» Notable BBQ in San Antonio: Two Bros. BBQ Market and 2M Smokehouse
4. Birmingham, Alabama
🌅 Spirit of the South
Birmingham residents are consumed by their passion for BBQ. The city scored a 99 out of 100 in our Google Trends metric, based on search volume for a variety of BBQ-related terms. That’s the second-highest score of the 50 cities we analyzed.
When it comes to specific BBQ terms, Birmingham beat out every city on our list for search activity of “BBQ sauce” — perhaps because of the state’s recognizable white BBQ sauce.
Fortunately, Birmingham BBQ fans have plenty of places to find the iconic sauce and other BBQ foods. The city has 4.0 BBQ restaurants per 100,000 people — 74% more than the average city on our list (2.3 per 100,000).
Plus, Birmingham has 1.1 BBQ food trucks per 100,000 people — 57% more than the average city we ranked (0.7 per 100,000).
Chowing down locally isn’t too expensive, either. A pound of BBQ meat in Birmingham costs about $5.29 — cheaper than the average of $5.32 per pound in our study.
» Notable BBQ in Birmingham: Rusty’s Bar-B-Q and Martin’s Bar-B-Que Joint
5. Las Vegas, Nevada
🌵 BBQ Capital of the West
Las Vegas stands out as the only city west of Texas to earn a spot in our top 15 BBQ cities, thanks to a wealth of BBQ restaurants and stellar Yelp reviews.
Finding quality BBQ in Las Vegas is a safe bet. The city has the most BBQ restaurants per capita in the country, with 5.9 per 100,000 people — 2.5x the average city in our study (2.3 per 100,000).
If that wasn’t enough, Las Vegas’ BBQ restaurants have the second-best Yelp ratings of any city we studied. The average BBQ restaurant in Sin City has 4.27 stars on Yelp. Only Los Angeles has a higher Yelp average.
Las Vegas would have ranked closer to the top had it not been for high BBQ prices. The city is located in the country’s most expensive region for BBQ. Buying BBQ meat — poultry, pork, and beef — costs about $5.86 per pound when averaged together.
» Notable BBQ in Las Vegas: Rollin Smoke Barbeque and Road Kill Grill
6. Nashville, Tennessee
💰 Deals on Wheels
Nashville has 1.2 BBQ food trucks per 100,000 residents — 71% more than the average city (0.7 per 100,000).
Music City’s BBQ scene is a hit, with 3.8 BBQ restaurants per 100,000 people — 65% more than the average city (2.3 per 100,000).
In addition to plenty of options, Nashville’s BBQ scene gets rave reviews, with restaurants averaging 4.01 stars on Yelp, better than the national average of 3.92 stars.
Not to mention, the city has a palpable passion for BBQ. Nashville notched a 79 out of 100 in our passion metric, based on the volume of Google searches for BBQ-related terms. That’s 14% higher than the average city we ranked (69 out of 100).
» Notable BBQ in Nashville: HoneyFire Barbeque Co. and Peg Leg Porker
7. Houston, Texas
🚀 Houston, We Don’t Have a Problem
The Houston BBQ scene has truly taken off. The city rocketed up our list this year after placing 18th in our 2022 report.
If you’re a fan of BBQ competitions, consider adding Houston to your 2023 travel plans. The metro area is scheduled to hold at least three more BBQ events before the end of 2023, more than any other metro on our list, according to data from BarbecueNews.com.
Houston tied Dallas for the most passionate BBQ city in Texas. Both cities scored a 97 out of 100 in our Google Trends metric, based on the volume of BBQ-related internet searches. That’s 41% higher than the average city’s score (69 out of 100).
But H-Town topped the Big D in terms of BBQ reviews. Houston’s BBQ restaurants average 4.13 stars on Yelp, the sixth-highest mark in the country, while Dallas’ eateries average 3.97 stars.
» Notable BBQ in Houston: Truth BBQ and Blood Bros. BBQ
8. Oklahoma City, Oklahoma
💨 Okie-Dokie, Nice and Smokey
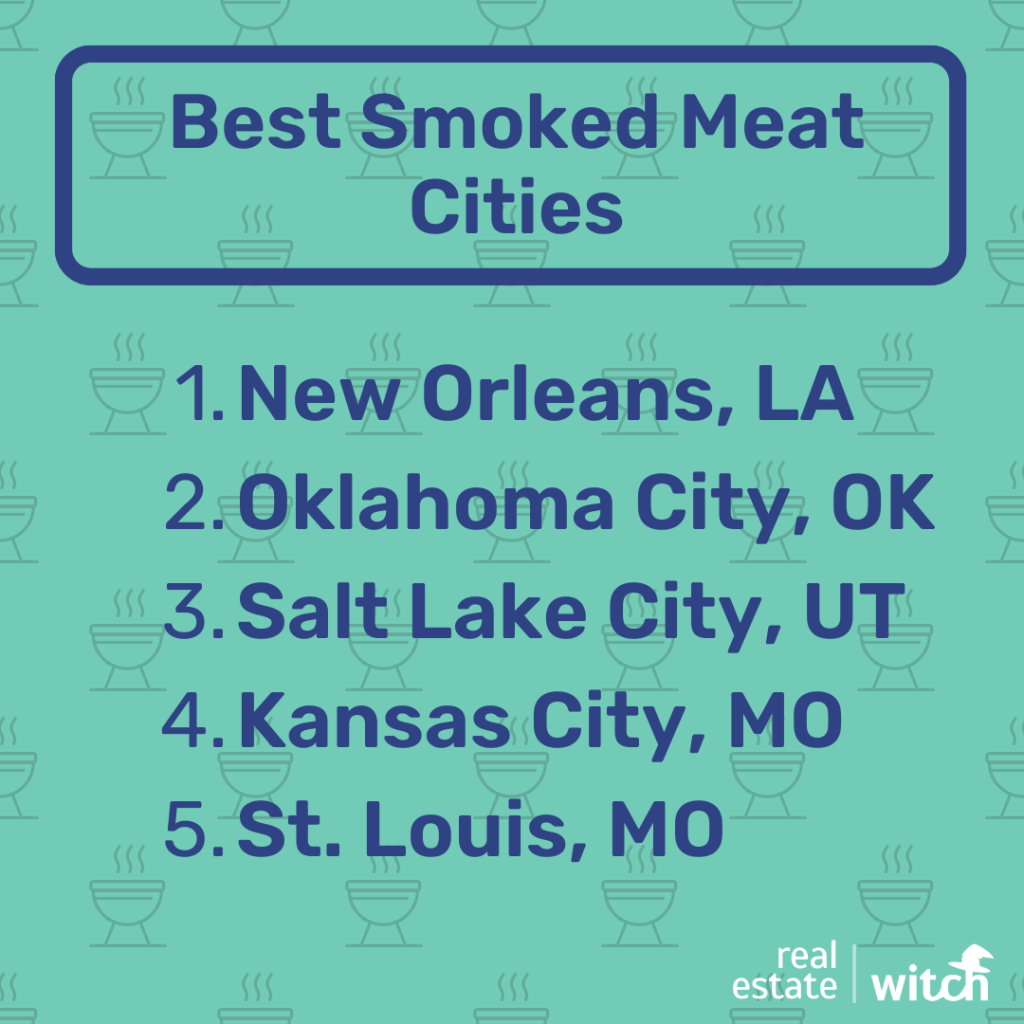
Oklahoma City ranks second in the country in online search volume for “smoked meat” — ahead of neighboring Missouri’s BBQ bastions of St. Louis and Kansas City.
One big perk of Oklahoma City BBQ is the price. Buying a pound of BBQ meats in OKC costs about $5.29 — cheaper than the average city’s price of $5.32.
The “O” in OKC could also stand for options. Oklahoma City has 3.1 BBQ restaurants per 100,000 people — 35% more than the average city (2.3 per 100,00). It also has 1.5 BBQ food trucks per 100,000 people — the third most in the country and 2x the average city (0.7 per 100,000).
Oklahoma City would have ranked even higher on our list, but its BBQ restaurants average just 3.6 stars on Yelp, the fifth-lowest average of the 50 cities we ranked.
» Notable BBQ in Oklahoma City: George’s Happy Hog Bar-B-Q and Texlahoma BBQ
9. Jacksonville, Florida
🐆 The Rib Eye of the Tiger
The home of the Jaguars is also the home of Florida’s best BBQ scene. Jacksonville surpassed Tampa (No. 15), Orlando (No. 17), and Miami (No. 47) in our best BBQ cities ranking.
One reason Jacksonville shines is its bounty of BBQ restaurants. Jacksonville has 3.4 BBQ restaurants per 100,000 people — 48% more than the average city on our list (2.3 per 100,000).
Jacksonville also provides options for diners on the dash, with 1.1 BBQ food trucks per 100,000 people — 57% more than the average city (0.7 per 100,000).
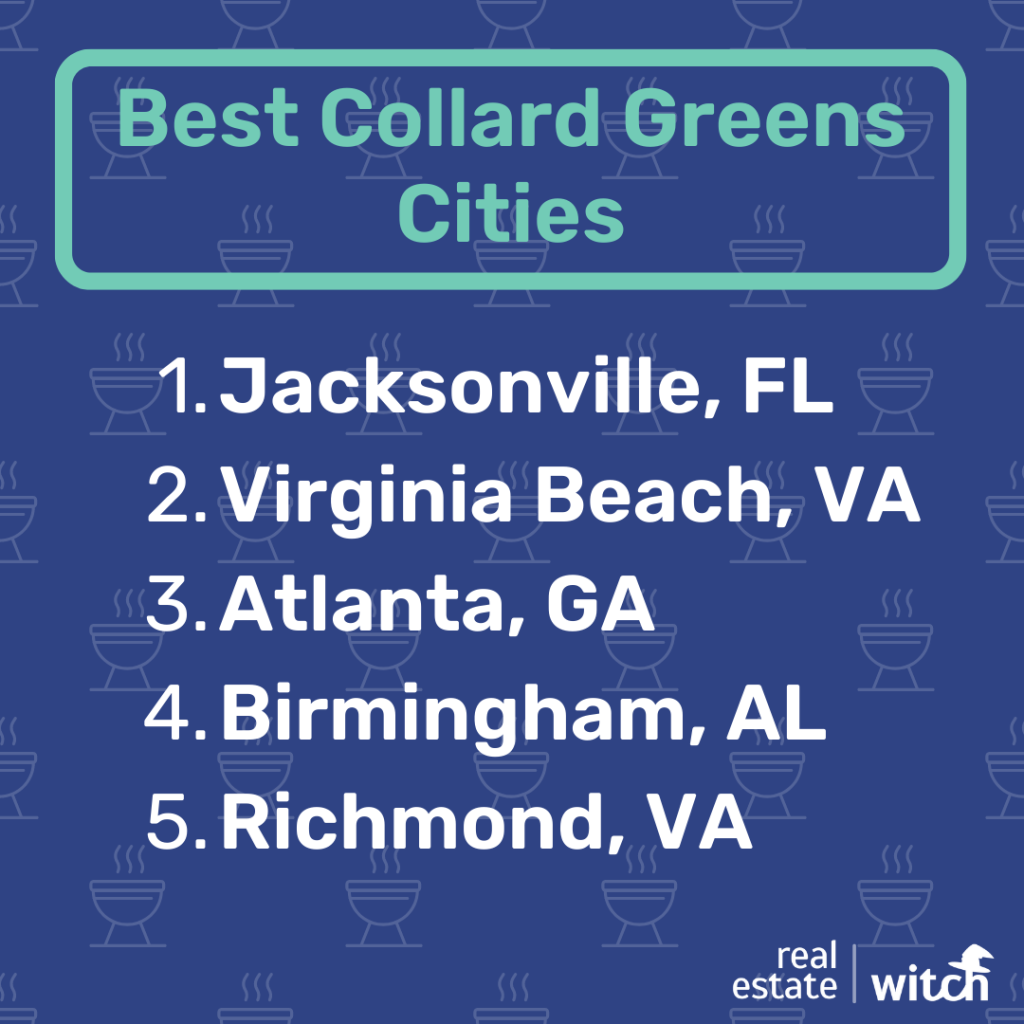
In terms of BBQ passion, Jacksonville ranks No. 1 nationally in online search interest for “collard greens.” Overall, the city earned a 77 out of 100 in our Google Trends metric, based on search volume for terms related to BBQ. That’s 12% better than the average city’s score of 69 out of 100.
» Notable BBQ in Jacksonville: Gators BBQ and The Bearded Pig
10. Raleigh, North Carolina
🚚 Wheely Great BBQ
North Carolina’s Research Triangle has cracked the code to BBQ on the go. Raleigh has 2.0 BBQ food trucks per 100,000 residents — the most of any city and nearly 3x as many as the average city (0.7 per 100,000).
Another thing working in Raleigh’s favor is its BBQ prices. BBQ meats in the region cost an average of $5.29 per pound — less expensive than the average city’s price of $5.32.
The city also performs well in our affordability metric. Based on the local income, buying a pound of BBQ meats every week for a year costs the average resident 0.30% of their annual income — cheaper than the average of 0.34%.
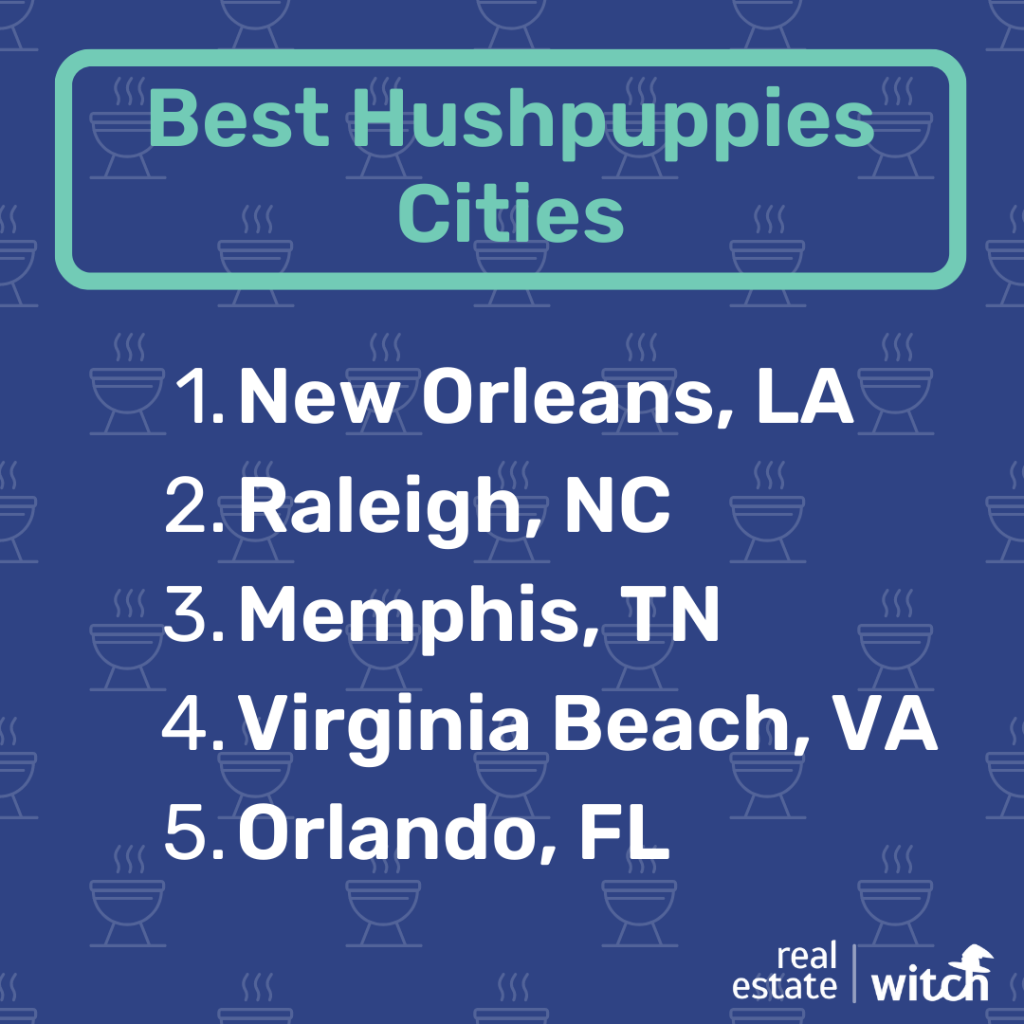
When it comes to interest in specific BBQ foods, Raleigh ranks No. 2 nationally for search interest in “hushpuppies” — deep-fried balls of cornmeal magic.
» Notable BBQ in Raleigh: Sam Jones BBQ and Ole Time Barbecue
11. St. Louis, Missouri
🏆 Best ‘Cue in Mizzou
St. Louis takes the trophy for the best BBQ city in the Show-Me State, topping No. 14 Kansas City thanks to better Yelp ratings, more affordability, and more BBQ spots per square mile.
St. Louis moved up 15 spots from our 2022 ranking of the best BBQ cities, when it landed at 26th. Since then, the city has improved in multiple metrics, including BBQ restaurants per capita, affordability of BBQ, and search interest in BBQ.
St Louis also has some of the strongest Yelp reviews for BBQ restaurants, averaging 4.09 stars — the eighth-highest rating of the 50 cities we ranked.
But St. Louis stands out most for its passion for BBQ. The Gateway City scored a perfect 100 in our Google Trends metric, based on the volume of online searches related to BBQ foods. That’s the highest score of any city and 45% higher than the average score of 69 out of 100.
Specifically, St. Louis ranked second nationwide for search interest in “BBQ sauce” and fifth nationwide for interest in “pulled pork.”
Despite some improvement, St. Louis still lagged behind other top cities, as it only has 1.9 BBQ restaurants per 100,000 people — 21% fewer than the average city (2.3 per 100,000).
» Notable BBQ in St. Louis: Pappy’s Smokehouse and Salt + Smoke
12. New Orleans, Louisiana
🐖 The Big Easy-to-Find BBQ City
Louisiana’s largest city has 3.2 BBQ restaurants per 100,000 people — 39% more than the average city we ranked (2.3 per 100,000).
In a city known for parades, it’s no wonder residents’ enthusiasm carries over into excitement for BBQ. In our Google Trends metric based on search activity for BBQ-related terms, New Orleans scored an 82 out of 100 — 19% higher than the average city’s score (69 out of 100).
In particular, New Orleans ranks No. 1 nationally for search interest in “smoked meat” and “hushpuppies.” It also ranks No. 2 for interest in “fried catfish” — outdone only by Memphis.
New Orleans residents can celebrate some of the lowest BBQ prices in the country. Buying a pound of BBQ meats in New Orleans costs an average of $5.29, less than the typical city’s cost of $5.32.
» Notable BBQ in New Orleans: The Joint and Pig Out Nola Barbecue
13. Buffalo, New York
❄️ The BBQ Capital of the North
Buffalo is the only city north of the Mason-Dixon line to earn a spot in the top 15 of our best BBQ city ranking.
In addition to its status as a regional BBQ powerhouse, Buffalo is the most improved BBQ city on our list, climbing up from No. 37 in our 2022 ranking.
Buffalo improved because of an increased number of BBQ restaurants per capita (2.7 per 100,000 people) and because it now has some of the lowest BBQ prices in the country. The regional price of $4.72 for a pound of BBQ meat is among the cheapest in the U.S.
Plus, Buffalo’s BBQ restaurants average 4.08 stars on Yelp — better than the typical city’s rating of 3.92 stars.
Solidifying its status as a sleeper pick for one of the best BBQ cities, Buffalo ranks No. 1 nationally for search interest in “pulled pork,” according to Google Trends data. Now that’s what we call being in hog heaven.
» Notable BBQ in Buffalo: Yankee BBQ and BBQ By Mike
14. Kansas City, Missouri
⚾ Swing and a Mizz
Kansas City may be the home of the Royals, but our findings call into question the city’s status as BBQ royalty. The city fell four spots in our ranking this year, down from 10th in 2022.
Let’s discuss the good news first. Kansas City has some of the best BBQ prices in the country. Buying BBQ meat in this region costs about $5.29 per pound, cheaper than the average of $5.32 in our study.
Kansas City also scored an 86 out of 100 in our BBQ passion metric, based on Google search activity for BBQ-related terms. That’s the 10th-highest score overall and includes ranking No. 3 for searches of “pulled pork.”
But there is some bad news. Although Kansas City performed above average in other metrics we used, it was barely above average. The city has:
- 2.5 BBQ restaurants per 100,000 people — 9% more than the average city on our list (2.3 per 100,000).
- 0.9 BBQ food trucks per 100,000 people — 29% more than the average city we analyzed (0.7 per 100,000).
- An average of 3.97 stars on Yelp for its BBQ restaurants, just above the average city’s rating of 3.92.
Although Kansas City might have some incredible individual BBQ restaurants, a look at the data shows the overall scene doesn’t blow away the competition as one might expect. It isn’t even the best BBQ city in Missouri, finishing three spots behind its intrastate rival, No. 11 St. Louis.
» Notable BBQ in Kansas City: Arthur Bryant’s Barbeque and Q39
15. Tampa, Florida
☀️ Sunshine State of Mind
Florida’s second city to make our top 15, Tampa’s biggest BBQ bragging point might be its Yelp ratings. The city’s BBQ restaurants average 4.21 stars on Yelp, the fourth-highest rating of the 50 cities we analyzed.
Plus, it’s not as if Tampa’s BBQ restaurants are few and far between. The city has 0.04 BBQ restaurants per square mile — the third-highest concentration in the U.S.
Meanwhile, Tampa scored a 72 out of 100 in our Google Trends metric, based on search activity for BBQ-related terms. That’s just above the average city’s score (69 out of 100).
Lastly, BBQ prices in Tampa are slightly better than average. The typical price for a pound of BBQ meat is $5.29, compared to $5.32 in other cities.
» Notable BBQ in Tampa: Al’s Finger Licking Good Bar-B-Que and 4 Rivers Smokehouse
Close Calls: BBQ Cities That Came Up Short
They can complain until the cows come home, but some cities with solid reputations for Southern cuisine missed our top 15.
- Dallas, Texas (No. 16): Dallas barely missed placing in the top 15, in part, because of a surprising low number of BBQ restaurants. The city has just 1.2 BBQ restaurants per 100,000 people — the fifth-lowest rate on our list.
- Atlanta, Georgia (No. 18): Atlanta scored highly on our Google Trends metric, with a 96 out of 100. But the city has just 1.6 BBQ restaurants per 100,000 people — 44% less than the national average (2.3 per 100,000).
Best BBQ City Rankings by Category
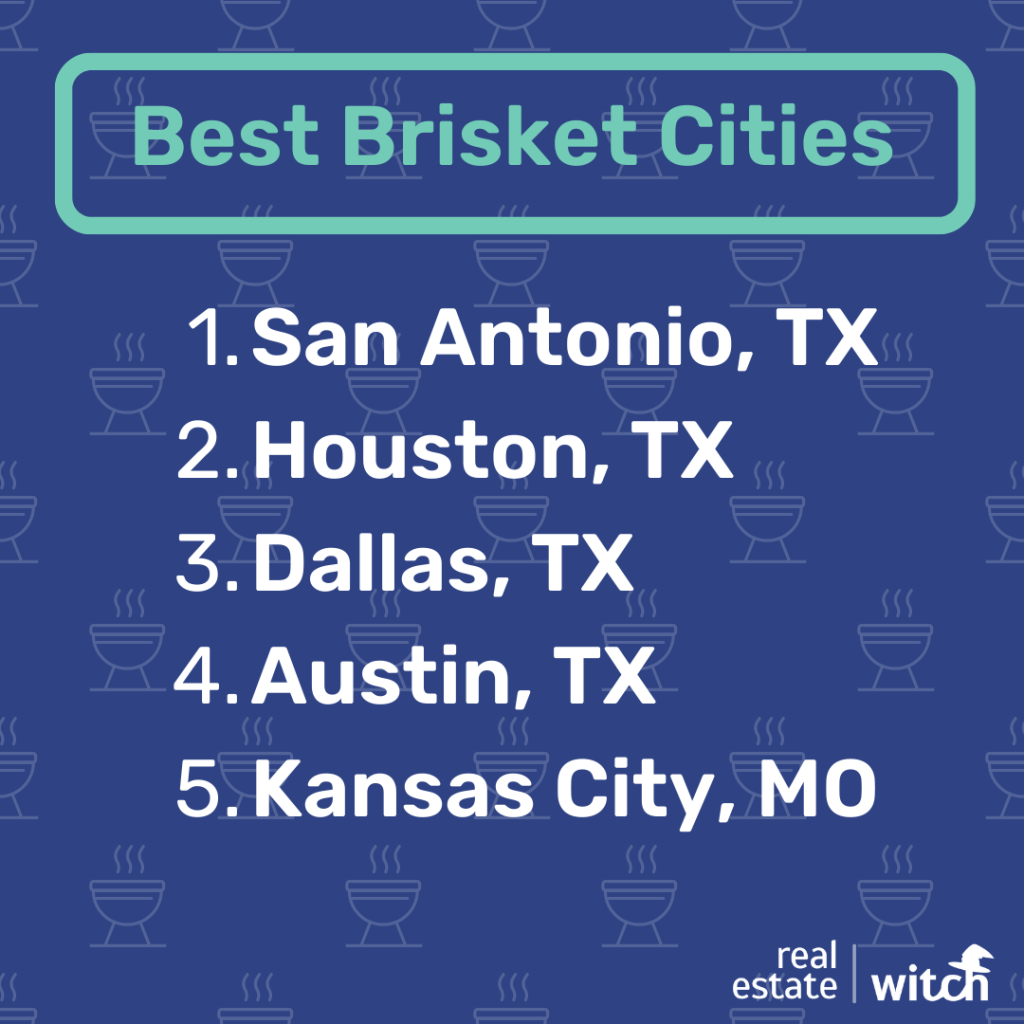
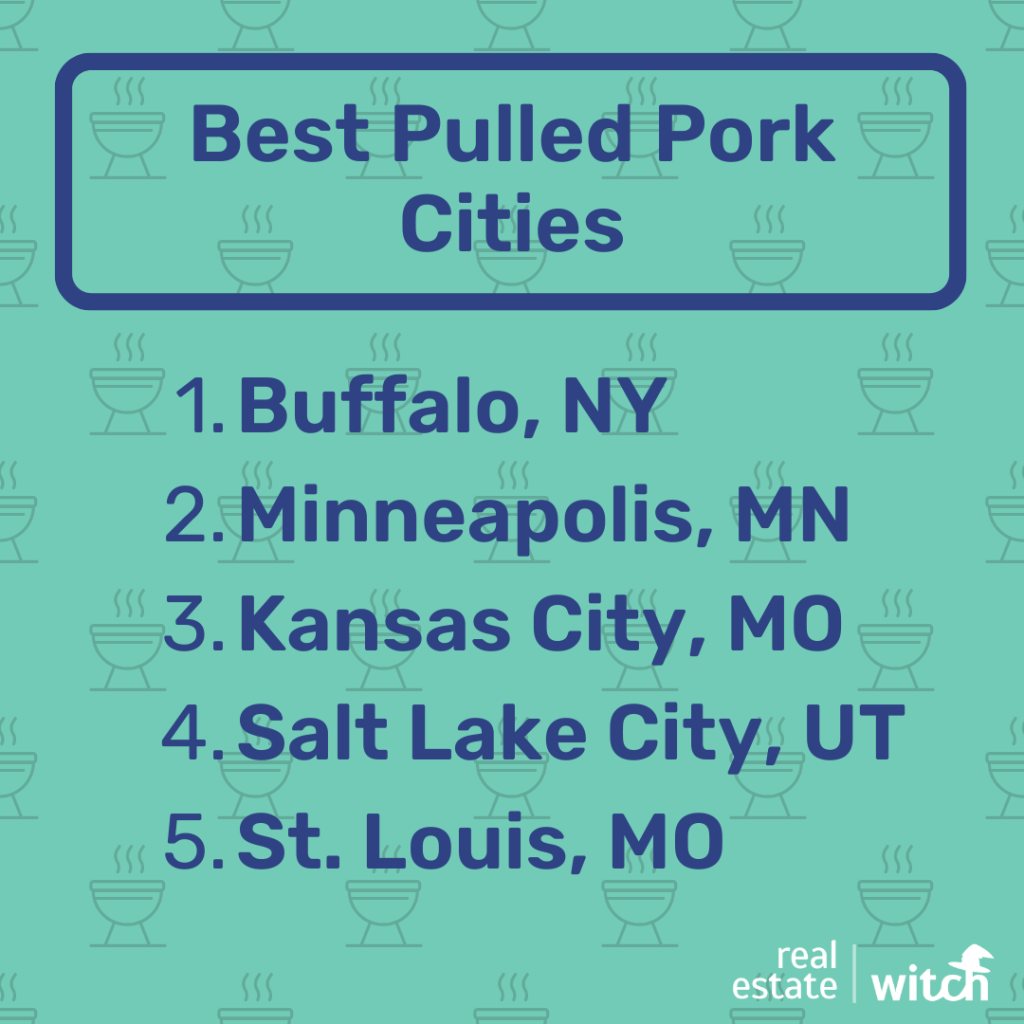
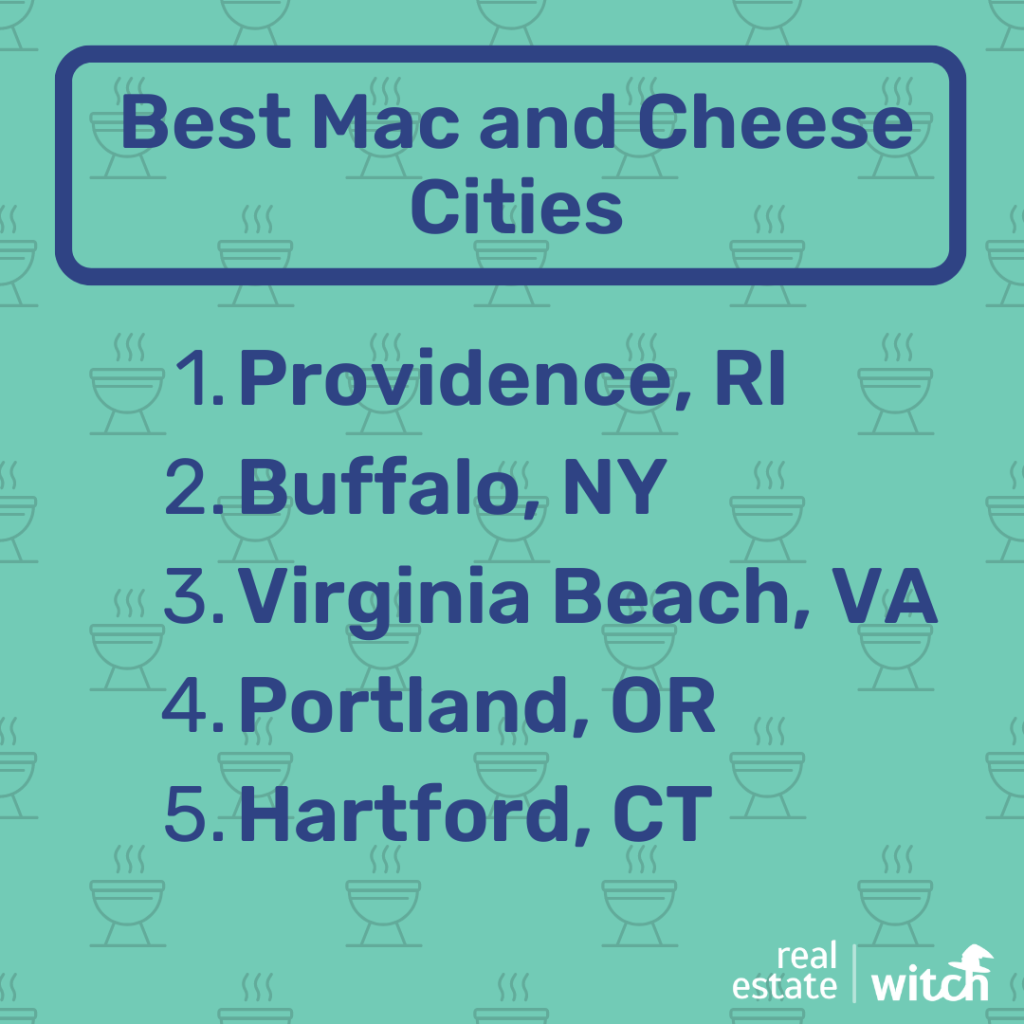
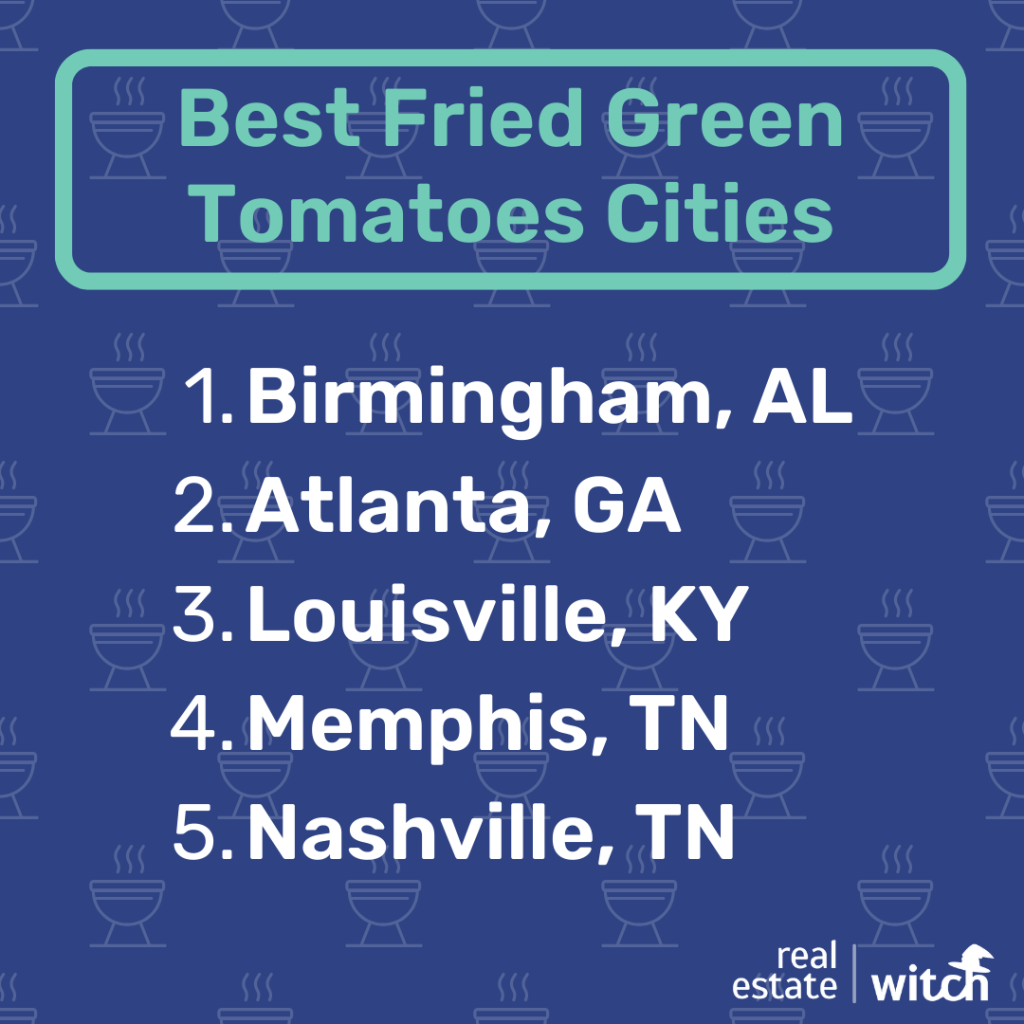
Using Google Trends data, we researched which cities most often search the internet for certain BBQ terms. Here’s what the results showed.
Worst BBQ: Cities That Got Smoked
When it comes to BBQ, not every city is living high on the hog. The bottom 10 cities on our list got torched by the competition. California, in particular, lagged behind other states, with four of its cities placing in the bottom 10.
- Riverside, California
- San Francisco, California
- San Diego, California
- Miami, Florida
- Seattle, Washington
- Phoenix, Arizona
- Salt Lake City, Utah
- Boston, Massachusetts
- Los Angeles, California
- Hartford, Connecticut
Riverside earned the unfortunate title of the worst BBQ city in our rankings. Riverside has just 0.7 BBQ restaurants per 100,000 people — about one-third of the average city (2.3 per 100,000). Additionally, Riverside’s BBQ spots average 3.76 stars on Yelp, worse than the average city’s rating of 3.92 stars.
Having the highest BBQ prices in the country ($5.86 per pound of BBQ meat) and the second-fewest BBQ food trucks per capita (0.2 per 100,000 people) certainly didn’t do this SoCal city any favors.
That’s not to say Riverside doesn’t have its own strengths. Our research previously named Riverside one of the 10 best taco cities in America.
Methodology
Real Estate Witch compared the 50 most-populous U.S. metro areas across a number of metrics, listed below. Each metric was normalized and then graded on a 100-point scale. The combined weighted average of the scores determined the “BBQ city” score upon which the final ranking was based. Data points were attributed to metropolitan areas as much as possible. For some data points, statewide data was used. For others, regional data was used.
The metrics used are as follows:
- BBQ restaurants per 100,000 residents (19.4%)
- Google Trends score for 12 general BBQ terms (19.4%)
- Number of BBQ food trucks per capita (16.1%)
- Percent of typical annual income spent on 4 pounds of BBQ meat per month (13%)
- Average of the regional prices for beef, pork, and chicken (13%)
- Average Yelp rating for BBQ restaurants in each city (9.7%)
- The presence of BBQ events in each city for the remainder of 2023 (6.5%)
- BBQ restaurants per square mile (3.2%)
Data sources include: U.S. Census Bureau’s American Community Survey, U.S. Bureau of Labor Statistics, Yelp, Google Trends, Roaming Hunger, and BarbecueNews.com.
About Real Estate Witch
You shouldn’t need a crystal ball or magical powers to understand real estate. Since 2016, Real Estate Witch has demystified real estate through in-depth guides, honest company reviews, and data-driven research. In 2020, Real Estate Witch was acquired by Clever Real Estate, a free agent-matching service that has helped consumers save more than $160 million on real estate fees. Real Estate Witch’s research has been featured in CNBC, Yahoo! Finance, Chicago Tribune, Black Enterprise, and more.
More Research From Real Estate Witch
- Life Skills by Generation: Are Americans losing everyday life skills? A new survey reveals Americans’ proficiency at everyday tasks and their knowledge of personal finance and real estate.
- Best Beer Cities in the U.S.: Raise a glass to the best beer cities in the U.S.! We gathered data on America’s 50 biggest metros to find the best ones for beer lovers.
- The Most and Least Affordable Cities for Renters: With rent outpacing income since 1985, we analyzed rent-to-income ratios in the 50 largest U.S. cities to find which are the most affordable.
Articles You Might Like
- 7 Best Companies That Buy Houses for Cash: These companies buy houses for cash, helping you sell your home quickly and conveniently — but at a cost.
- Offerpad Reviews from Real Customers: Offerpad promises fast, hassle-free cash offers. How does it compare to Opendoor? Find the truth about this iBuyer’s fees and more.
- The Best Discount Real Estate Brokers for Every Budget: Find the best discount real estate brokers for every budget in every state. Compare fees and savings to learn which company is right for you.
Frequently Asked Questions About the Best BBQ Cities
What's the best BBQ city in the U.S.?
Austin is the best BBQ city in the U.S. with 4.7 BBQ restaurants per 100,000 residents — double the national average. Its BBQ restaurants average 4.22 stars on Yelp. Learn more about the best BBQ cities in America.
What state has the best BBQ?
Texas is the best state for BBQ. The Lone Star State has three of the top 10 BBQ cities in the country — Austin, San Antonio, and Houston. Learn more about the best cities for BBQ.
What city has the best BBQ in Missouri?
St. Louis is the best BBQ city in Missouri. BBQ restaurants in St. Louis average better reviews on Yelp than BBQ restaurants in Kansas City. See our full ranking of the best BBQ cities.

Leave a Reply