Published
🌵 West vs. Southwest 🌵
California and Texas are wrestling for taco superiority. California has four cities in the top 15 — one more than Texas. However, a Texas city, Austin, has won the No. 1 spot two years in a row.
Best Taco Cities, Ranked | Top 15 Taco Cities | Most Passionate Taco Cities | 10 Worst Taco Cities | Methodology | FAQ
Tacos have become an integral part of American cuisine, captivating the taste buds of millions across the country. It’s estimated that Americans consume 4.5 billion tacos a year, helping the overall Mexican restaurant industry reach $79 billion in 2022.
Tacos are so important to Americans that businesses are willing to fight for them. Recently, a clash between Taco John’s, the owner of the “Taco Tuesday” trademark, and fast-food giant Taco Bell had intensified but ultimately ended in Taco John’s conceding.
Let’s face it, though: Real taco lovers aren’t running to Taco Bell for enchiritos or IHOP for a taco pancake. They’re heading to their locally owned spots to indulge. With the passion and palates that true taco enthusiasts possess, it’s crucial to uncover the cities that satisfy their cravings.
To determine the best cities for taco aficionados in America, we analyzed data from the U.S. Census, U.S. Bureau of Labor Statistics, Yelp, Numbeo, and Google Trends.
Our weighted rankings evaluated criteria including:
- 6x: Taco restaurants per 100,000 residents
- 4x: Average Yelp star rating of taco places
- 3x: Cost of taco supplies — prices for 1 pound each of cheese, chicken, lettuce, tomato, and onion
- 3x: Affordability of weekly taco supplies as a percentage of average income
- 2x: Taco passion — Google Trends scores for 23 taco-related terms, such as “tacos,” “tacos near me,” “taco recipe,” “taco truck,” “Taco Tuesday,” etc.
- 2x: Taco restaurants per square mile
- 1x: Percentage of restaurants that are taco places
Let’s dive in!
Best Taco Cities Stats 🌮
- Austin, Texas, is America’s best taco city, while Cleveland is the worst. Jump to section👇
- Austin has the highest percentage of restaurants that are taco places — 7.4%.👇
- Overall, the best state for tacos is California, with four cities placing in our top 15.👇
- San Jose, California, has the most taco restaurants per 100,000 residents (8.2), while Memphis has the fewest (0.4).👇
- Las Vegas has the highest-rated taco restaurants according to Yelp, with an average rating of 4.36, while Buffalo has the lowest (3.55).👇
- The most affordable city based on the cost of making tacos weekly for a month is Richmond, Virginia ($18.33), while the least affordable is San Francisco ($32.79).👇
- As our worst city for taco places, Cleveland has only 1 taco place per 100,000 residents, 91% fewer than the average city (2.3).👇
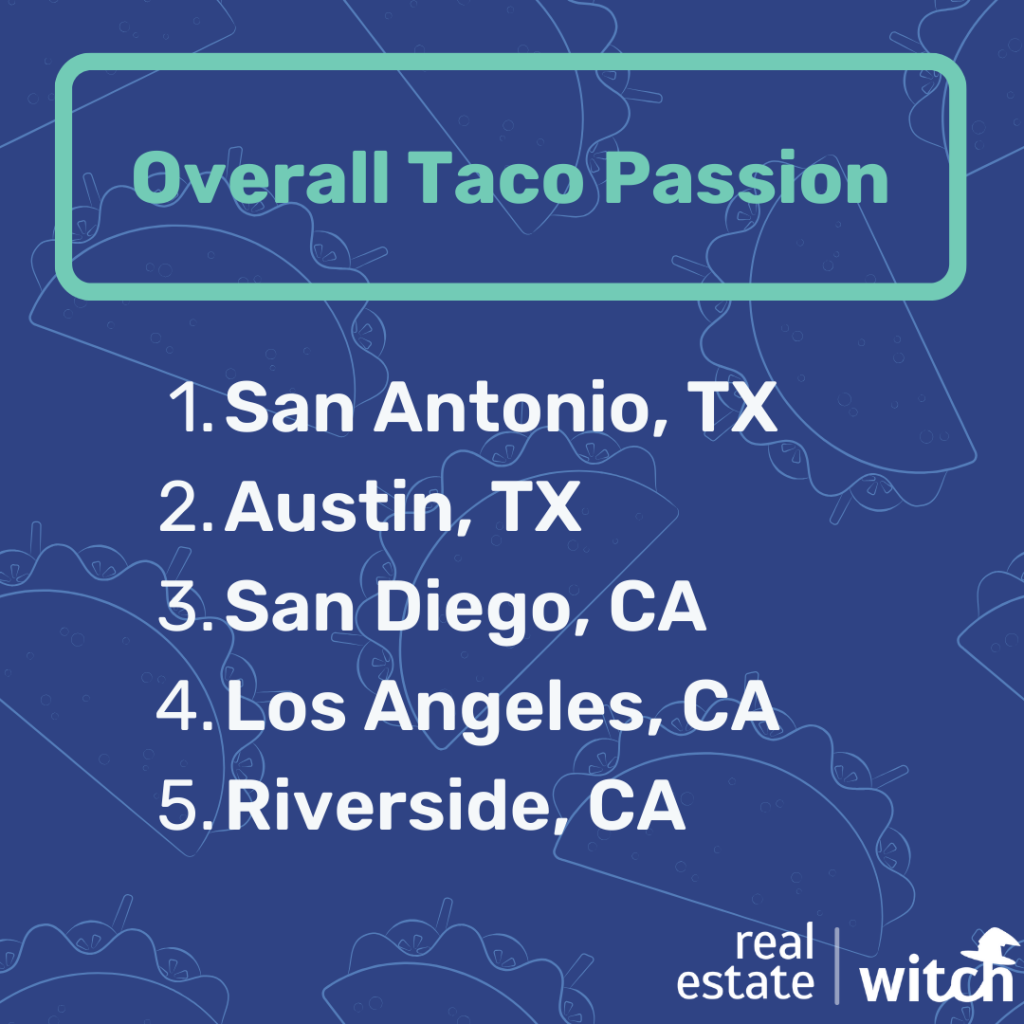
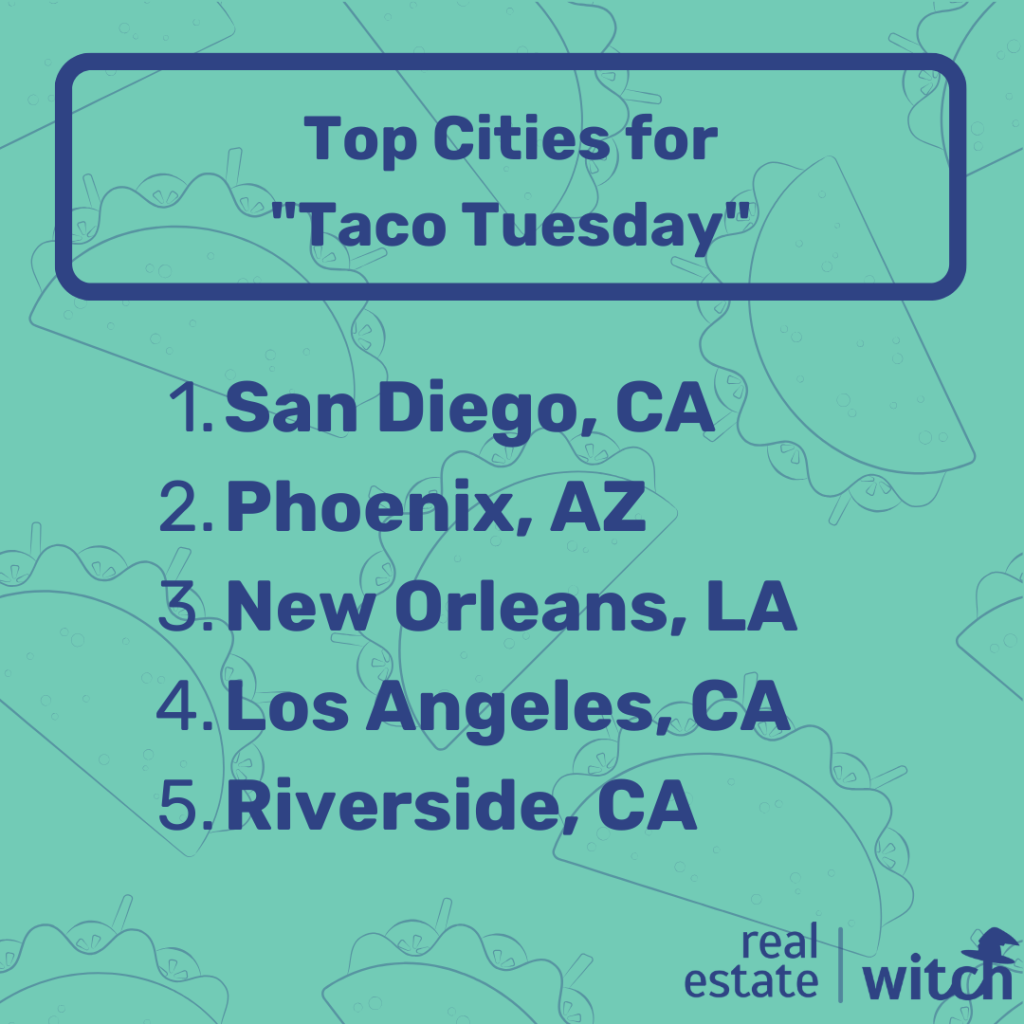
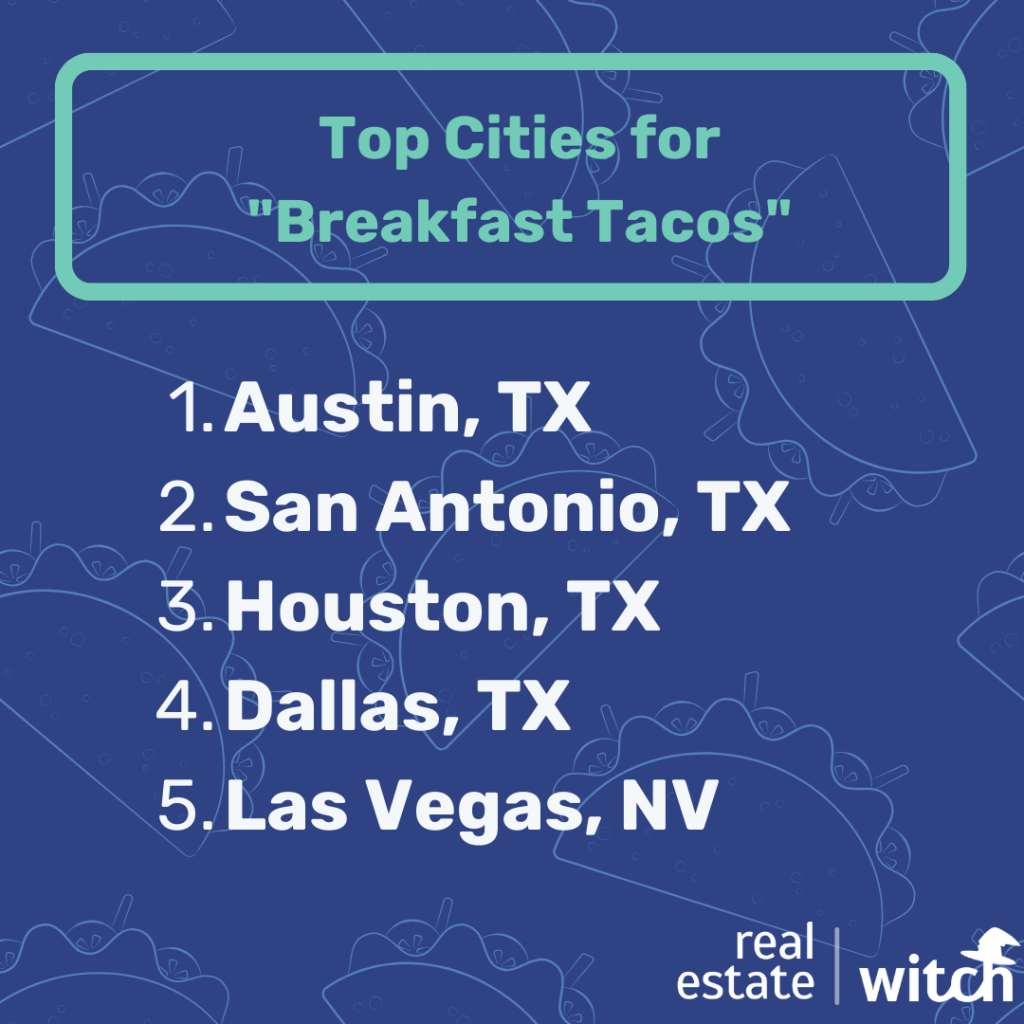
- San Antonio has the most taco passion, based on Google search trends.👇
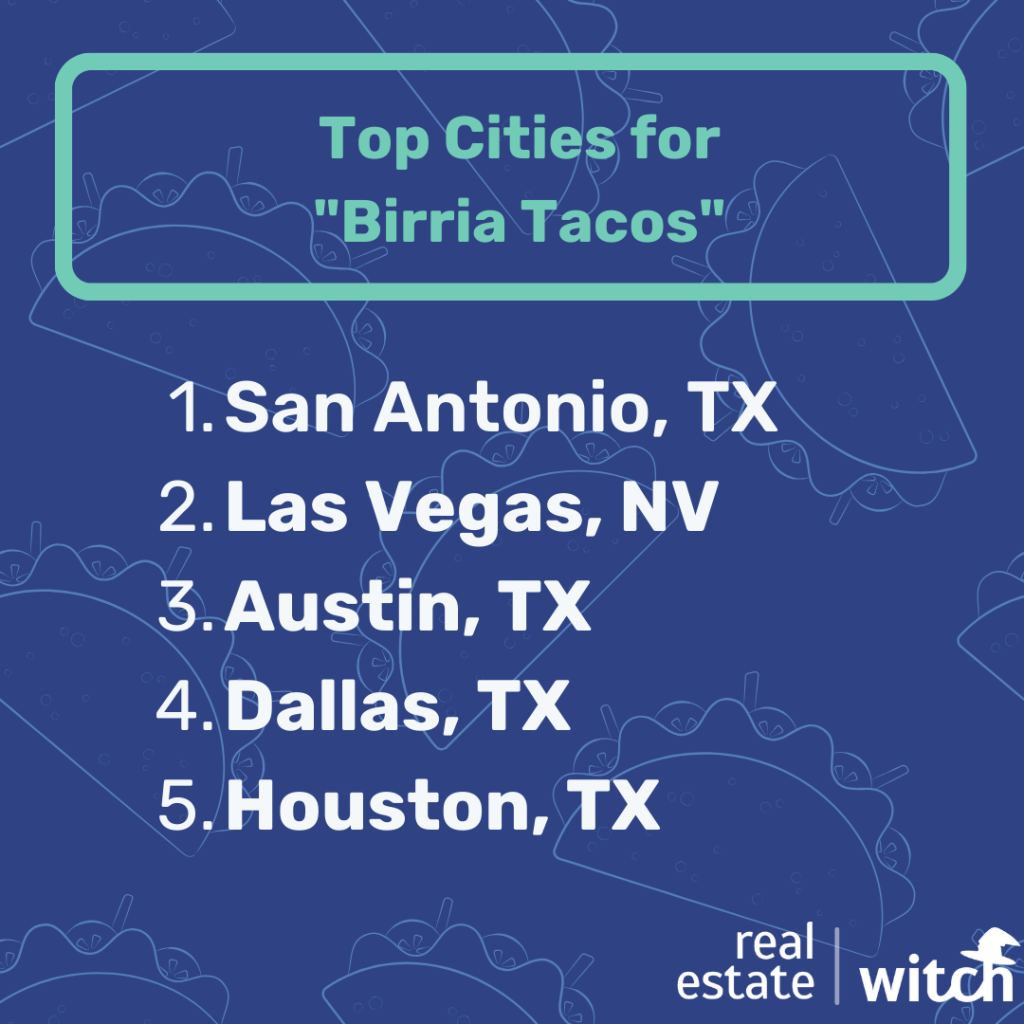
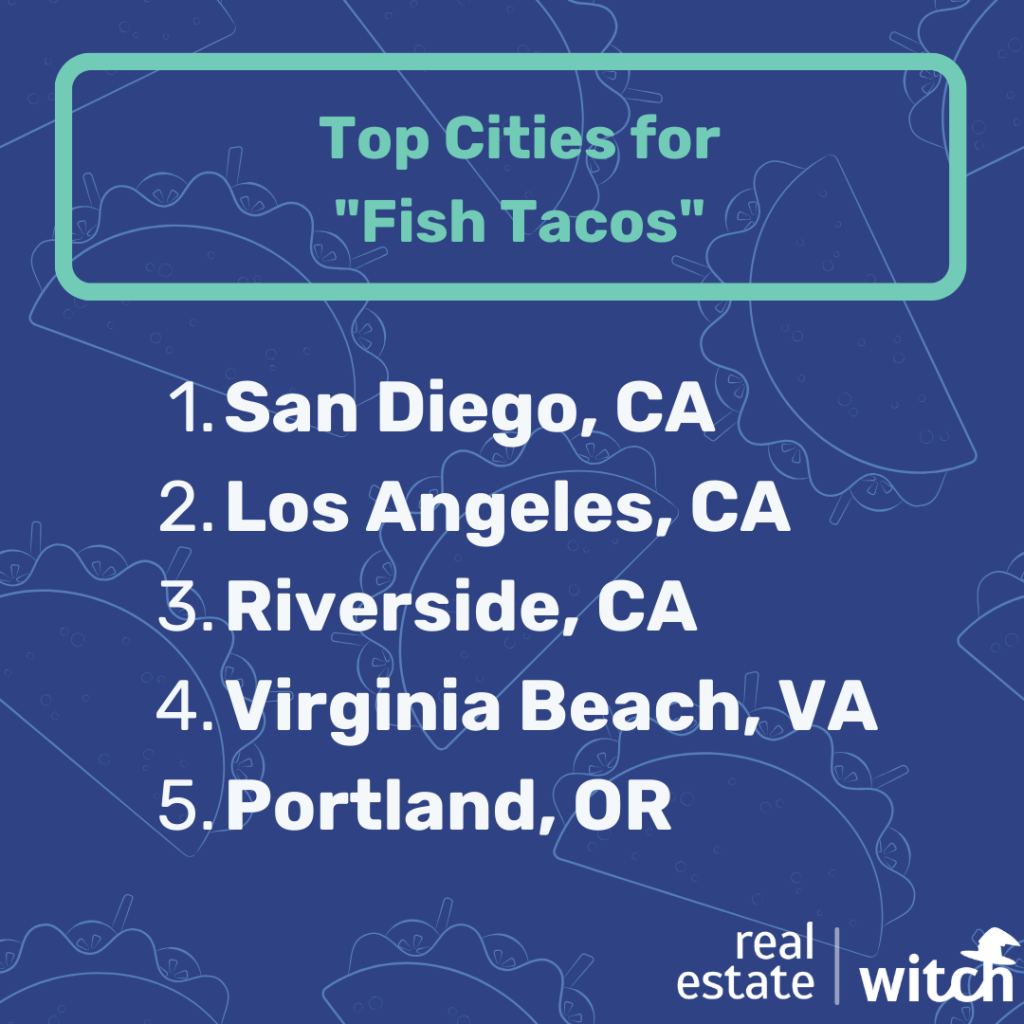
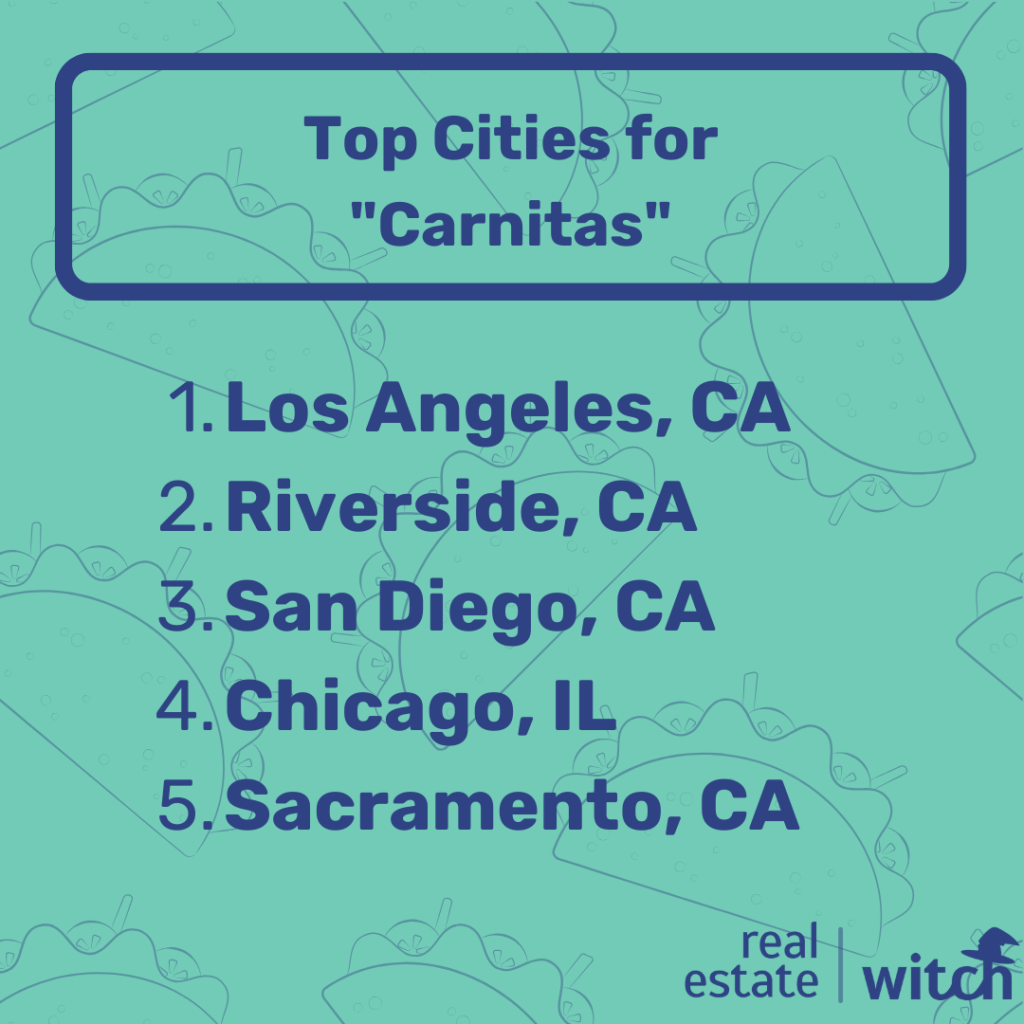
- San Antonio is the No. 1 city for birria tacos, Los Angeles is No. 1 for carnitas tacos, and San Diego is No. 1 for fish tacos, based on Google Trends.👇
The 50 Best Taco Cities, Ranked
| Rank | City | Taco Places per Capita | Avg. Yelp Star Rating of Taco Place | % of Restaurants That Are Taco Places | Taco Passion Score* | Price of Taco Supplies** | Weekly Taco Supply Costs as % of Income | Taco Places per Square Mile |
|---|---|---|---|---|---|---|---|---|
| – | National Average | 2.3 | 4.1 | 2.7% | 61.7 | $24.28 | 1.7% | 0.017 |
| 1 | Austin, TX | 7.9 | 4.31 | 7.4% | 96 | $22.81 | 1.4% | 0.038 |
| 2 | San Jose, CA | 8.2 | 4.34 | 4.7% | 63 | $27.01 | 1.0% | 0.049 |
| 3 | Las Vegas, NV | 7.2 | 4.36 | 4.4% | 85 | $21.19 | 1.7% | 0.064 |
| 4 | San Antonio, TX | 5 | 4.26 | 5.2% | 100 | $20.08 | 1.6% | 0.024 |
| 5 | San Diego, CA | 5.4 | 4.3 | 5.1% | 95 | $27.40 | 1.6% | 0.039 |
| 6 | Los Angeles, CA | 3.7 | 4.35 | 5.5% | 93 | $25.20 | 1.6% | 0.06 |
| 7 | Phoenix, AZ | 2.4 | 4.17 | 5.4% | 85 | $20.82 | 1.4% | 0.028 |
| 8 | Riverside, CA | 2.2 | 3.89 | 6.9% | 93 | $21.33 | 1.4% | 0.032 |
| 9 | Denver, CO | 3.5 | 4.25 | 3.2% | 78 | $25.06 | 1.4% | 0.042 |
| 10 | Houston, TX | 2.7 | 4.15 | 5.6% | 79 | $20.69 | 1.5% | 0.027 |
| 11 | Salt Lake City, UT | 2.9 | 4.27 | 2.6% | 72 | $20.28 | 1.3% | 0.018 |
| 12 | Oklahoma City, OK | 3.7 | 4.07 | 3.8% | 69 | $19.99 | 1.7% | 0.012 |
| 13 | Sacramento, CA | 3.6 | 4.34 | 4.6% | 75 | $30.44 | 1.9% | 0.06 |
| 14 | Milwaukee, WI | 2.2 | 3.94 | 2.3% | 69 | $18.67 | 1.4% | 0.005 |
| 15 | Richmond, VA | 1.8 | 3.88 | 1.9% | 46 | $18.33 | 1.3% | 0.015 |
| 16 | Raleigh, NC | 2 | 4.24 | 2.4% | 53 | $22.10 | 1.3% | 0.008 |
| 17 | Kansas City, MO | 1.6 | 4.06 | 3.0% | 70 | $21.38 | 1.5% | 0.004 |
| 18 | Portland, OR | 3 | 4.22 | 2.0% | 77 | $27.19 | 1.7% | 0.013 |
| 19 | Louisville, KY | 2.3 | 4.22 | 2.3% | 47 | $21.10 | 1.7% | 0.005 |
| 20 | Dallas, TX | 1.6 | 3.94 | 4.8% | 83 | $23.39 | 1.6% | 0.004 |
| 21 | Minneapolis, MN | 1.1 | 4.04 | 2.0% | 56 | $22.00 | 1.3% | 0.008 |
| 22 | Washington, DC | 1.4 | 4.05 | 1.7% | 48 | $24.97 | 1.2% | 0.02 |
| 23 | Indianapolis, IN | 2.1 | 3.98 | 3.4% | 52 | $22.47 | 1.7% | 0.011 |
| 24 | Chicago, IL | 1.6 | 4.16 | 2.6% | 78 | $25.66 | 1.7% | 0.017 |
| 25 | Cincinnati, OH | 1.1 | 4.21 | 1.6% | 44 | $21.05 | 1.5% | 0.005 |
| 26 | Columbus, OH | 1.7 | 4.21 | 1.9% | 45 | $23.42 | 1.7% | 0.01 |
| 27 | Birmingham, AL | 2 | 4.23 | 2.4% | 38 | $22.04 | 1.9% | 0.003 |
| 28 | Nashville, TN | 3 | 4.02 | 3.3% | 56 | $27.61 | 2.0% | 0.011 |
| 29 | Orlando, FL | 1.3 | 4.07 | 1.5% | 58 | $22.91 | 1.8% | 0.005 |
| 30 | Baltimore, MD | 0.8 | 3.74 | 1.0% | 53 | $22.87 | 1.4% | 0.003 |
| 31 | Atlanta, GA | 0.9 | 3.81 | 2.0% | 57 | $23.68 | 1.6% | 0.008 |
| 32 | San Francisco, CA | 2 | 4.27 | 1.9% | 63 | $32.79 | 1.5% | 0.021 |
| 33 | St. Louis, MO | 1 | 3.64 | 2.2% | 56 | $23.43 | 1.7% | 0.009 |
| 34 | Tampa, FL | 1.3 | 4.1 | 2.3% | 59 | $25.85 | 2.1% | 0.028 |
| 35 | Seattle, WA | 1.4 | 4.13 | 1.7% | 69 | $29.96 | 1.5% | 0.007 |
| 36 | Buffalo, NY | 2.6 | 3.55 | 2.5% | 34 | $23.84 | 2.0% | 0.005 |
| 37 | Virginia Beach, VA | 0.4 | 3.57 | 1.0% | 67 | $22.71 | 1.6% | 0.005 |
| 38 | Charlotte, NC | 1.4 | 3.93 | 2.2% | 53 | $25.58 | 1.9% | 0.008 |
| 39 | Providence, RI | 1.2 | 4.23 | 1.3% | 38 | $25.97 | 1.8% | 0.008 |
| 40 | New Orleans, LA | 2.6 | 4.26 | 1.5% | 53 | $26.68 | 2.4% | 0.008 |
| 41 | Jacksonville, FL | 1 | 4 | 1.3% | 52 | $24.58 | 1.9% | 0.006 |
| 42 | Detroit, MI | 0.7 | 4.03 | 1.8% | 52 | $24.43 | 1.9% | 0.008 |
| 43 | Memphis, TN | 0.4 | 3.9 | 0.7% | 40 | $20.25 | 1.9% | 0.001 |
| 44 | Philadelphia, PA | 0.7 | 3.98 | 0.9% | 52 | $26.33 | 1.7% | 0.009 |
| 45 | Miami, FL | 1.2 | 4.09 | 2.1% | 54 | $25.46 | 2.1% | 0.01 |
| 46 | New York, NY | 1.4 | 4.23 | 1.8% | 44 | $32.09 | 2.0% | 0.034 |
| 47 | Hartford, CT | 0.7 | 4.06 | 0.8% | 49 | $27.35 | 1.7% | 0.002 |
| 48 | Pittsburgh, PA | 1.2 | 4.02 | 1.4% | 41 | $26.74 | 2.1% | 0.014 |
| 49 | Boston, MA | 0.6 | 3.65 | 0.8% | 46 | $29.28 | 1.5% | 0.004 |
| 50 | Cleveland, OH | 1 | 3.74 | 1.5% | 51 | $27.48 | 2.3% | 0.001 |
The 15 Best Taco Cities
Although the rankings of our top two taco cities — Austin, Texas, and San Jose, California, respectively — remain the same from last year, our third-place taco city has experienced a shake up.
Unfortunately for San Antonio, it fell one spot to No. 4 on the list, knocked out by Las Vegas, which moved up three spots this year. San Diego rounds out the top five this year after moving up three spots from eighth place in 2022.
This year’s top 15 also has some newcomers: Salt Lake City and Richmond, Virginia, ranking 11th and 15th, respectively. Richmond made an impressive leap up the ranks, moving up 13 spots to enter the top 15.
| Rank | City | 2023 Rank | 2022 Rank | Rank Change +/- |
| 1 | Austin, TX | 1 | 1 | 0 |
| 2 | San Jose, CA | 2 | 2 | 0 |
| 3 | Las Vegas, NV | 3 | 6 | 3 |
| 4 | San Antonio, TX | 4 | 3 | -1 |
| 5 | San Diego, CA | 5 | 8 | 3 |
| 6 | Los Angeles, CA | 6 | 5 | -1 |
| 7 | Phoenix, AZ | 7 | 9 | 2 |
| 8 | Riverside, CA | 8 | 10 | 2 |
| 9 | Denver, CO | 9 | 11 | 2 |
| 10 | Houston, TX | 10 | 7 | -3 |
| 11 | Salt Lake City, UT | 11 | 17 | 6 |
| 12 | Oklahoma City, OK | 12 | 4 | -8 |
| 13 | Sacramento, CA | 13 | 15 | 2 |
| 14 | Milwaukee, WI | 14 | 13 | -1 |
| 15 | Richmond, VA | 15 | 28 | 13 |
1. Austin, TX
🏆 Don’t Taco ‘Bout It, Be About It
We have to congratulate Austin for taking the No. 1 spot for the second year in a row! No one can say tacos aren’t popular in the Texas capital. Austin has 7.9 taco joints per 100,000 residents, 242% more than the average city (2.3).
One could argue that Austin is taco heaven. With 0.038 taco restaurants per square mile, Austin surpasses the average city in our study (0.017) by an impressive 128%.
The city’s dedication to all things tacos is highlighted by its Google Trends score of 95.9 out of 100, a whopping 55% higher than the average city in our study (61.7). But there’s more to the taco love — 7.4% of all restaurants in Austin are dedicated to tacos, an exceptional 172% higher than the average city (2.7%).
The tacos in Austin also come highly rated. The city has an average Yelp rating of 4.31 — 6% higher than the average city in our study (4.07).
» Best Places for Tacos in Austin: Palo Seco and El Primo
2. San Jose, CA
💪 A True Contender
San Jose is also No. 2 for the second year in a row! And they’ve earned it. In San Jose, 4.7% of all restaurants in the city are taco places — 73% higher than the average city in our study (2.7%).
San Jose offers a great array of taco spots to choose from. It’s home to an astounding 8.2 taco restaurants per 100,000 residents, 257% more than the average city (2.3).
The fiesta doesn’t stop there: San Jose brings affordability to the table. The median household spends only 1% of its annual income preparing tacos at home once per week. That’s a pocket-friendly 40% less than the average city (1.7%). Many Americans will be surprised to learn that despite California’s reputation as an expensive state, its tacos and coffee are cheaper than many other parts of the country.
» Best Places for Tacos in San Jose: Tacos El Güero and Rubio’s
3. Las Vegas, NV
🎰 Tripas Las Vegas
Las Vegas is world-renowned for its food scene, so of course, it is also home to some great taco places — and lots of them. In Sin City, 4.4% of all restaurants in the city are taco places, 61% higher than the average city in our study (2.7%).
Prepare to roll the dice and indulge in a taco paradise in none other than Las Vegas. With an impressive 7.2 taco restaurants per 100,000 residents, a staggering 215% higher than the average city in our study (2.3), Las Vegas delivers taco extravaganza like no other.
With an average Yelp rating of 4.36, Las Vegas outshines the average city in our study (4.07) by an impressive 7.1%. The Yelp ratings don’t lie — Las Vegas has more than earned its spot as the No. 3 taco city in America, beckoning taco enthusiasts with its vibrant food scene beyond The Strip.
» Best Places for Tacos in Las Vegas: Tacos El Gordo and Bajamar Seafood & Tacos
4. San Antonio, TX
🌮 Time to Shell-ebrate
San Antonio is one of the top taco destinations in the country, so it comes as no surprise that its locals love tacos more than most. San Antonio has a perfect Google Trends score of 100, 62% higher than the average city (61.7).
Get ready to “taco ’bout” San Antonio because this city knows how to spice things up! With 5 taco restaurants per 100,000 residents, they’ve got 119% more taco spots than the average city in our study (2.3).
The best part is that an impressive 5.2% of all restaurants in San Antonio are dedicated to tacos, which means there are 92% more taco joints there than the average city (2.7%). When it comes to quality, San Antonio holds its own with an impressive average Yelp rating of 4.26, 5% higher than the national average of 4.07.
» Best Places for Tacos in San Antonio: La Maceta and Tacos El Amigo
5. San Diego, CA
🐟 Hooked on Tacos
It’s no secret that San Diegans love their tacos. San Diego has an average Google Trends score of 94.9 out of 100— 54% higher than the average city in our study (61.7).
Although most Americans just call them “fish tacos,” residents of San Diego lovingly refer to their take on this classic as “baja tacos.” And their love for these tacos shows: San Diego beat out two other California cities in the top 3 for most fish tacos , Los Angeles and Riverside, for most “fish tacos” passion based on Google Trends scores.
San Diego also has a plethora of taco spots compared to other cities. With 5.4 taco restaurants per 100,000 residents, San Diego has 136% more per capita than average (2.3). We found that 5.1% of all restaurants in the city are taco places, 87% higher than the average city in our study (2.7%)
» Best Places for Tacos in San Diego: The Taco Stand and Four Tunas Fish & Bar
6. Los Angeles, CA
🌶 The Spice of Life
Los Angeles continues to carve out a name for itself as a taco destination. Here’s a mind-blowing stat: 5.5% of all restaurants in the city are taco joints, more than double the average city (2.7%).
Prepare to have your taste buds tingle in the taco paradise that is Los Angeles. This vibrant city sets the bar high with a lush 0.06 taco restaurants per square mile, leaving the average city in our study (0.017) in the dust with an amount that’s higher by 262%.
Los Angeles also knows how to keep the taco passion alive. Its average Google Trends score of 92.7 is 50% higher than the study’s average (61.7). In particular, Angelenos search for “carnitas” more than residents in any other city.
» Best Places for Tacos in Los Angeles: Cielito Lindo and Tacos Los Palomos
7. Phoenix, AZ
😋 Sizzling Ratings
Phoenix is known for being an oasis for quality cuisine, and that applies to its taco scene. Phoenix has an average Yelp rating of 4.17 — 2.5% higher than the average city in our study (4.07).
Phoenix takes taco enthusiasm to new heights, with an average Google Trends score of 85.3 out of 100, soaring 38.2% higher than the average city in our study (61.7). Also in Phoenix, a staggering 5.4% of all restaurants are dedicated to serving these tantalizing treats, compared to just 2.7% in the average city. That means Phoenix has a 98% higher percentage of taco restaurants than average.
You can also satisfy your taco cravings without burning a hole in your wallet. The average cost to make tacos once a week each month in Phoenix stands at a pocket-friendly $20.82, 14% lower than the study’s average ($24.28).
» Best Places for Tacos in Phoenix: Tacos Tijuana and Taco Chelo
8. Riverside, CA
👀 A Whole Lotta Tacos
Riverside is another city chock full of tacos. In Riverside, 6.9% of all restaurants in the city are taco places, 152% more than the average city in our study (2.7%).
Get ready to dive into Riverside, where the taco love runs deep. This city boasts an impressive 0.032 taco restaurants per square mile, a staggering 92.8% more than the average city in our study (0.017), ensuring you’ll never run out of delicious options.
The taco fever in Riverside is truly palpable, with an average Google Trends score of 92.7 out of 100, a remarkable 50% higher than the study’s average (61.7). The cherry on top is that making tacos once a week won’t break the bank. The average cost in Riverside stands at $21.33, an enticing 12% lower than the study’s average ($24.28).
» Best Places for Tacos in Riverside: Dos Hermanas and Green Taco
9. Denver, CO
🏔 Mountains of Tacos
Denver is a taco lover’s dream with 3.5 taco restaurants per 100,000 residents, setting the bar 51% higher than the average city in our study (2.3).
Denver not only has a lot more taco places than most cities — it also has a significantly higher density of them. Taco tour, anyone? Denver has 0.042 taco restaurants per square mile, 150% more than the average city in our study (0.017).
With an average Google Trends score of 78.3 out of 100, this city’s taco obsession is 27% higher than the average city in our study (61.7). The taco game remains strong in Denver, where 3.2% of all restaurants are dedicated to tacos, surpassing the study’s average by 18% (2.7%).
» Best Places for Tacos in Denver: La Calle and Tacos Tequila Whiskey
10. Houston, TX
🌯 Deep in the Heart of Tacos
Houston is the biggest city in Texas, and with that comes a lot of taco options. In Space City, 5.6% of all restaurants are taco places. That’s more than double the average city in our study (2.7%).
Houston is a taco lover’s paradise. With 2.7 taco restaurants per 100,000 residents, this city surpasses the average (2.3) by 15%, ensuring that taco enthusiasts will find their taco fix in abundance.
But Houston doesn’t stop at just quantity. Its taco passion shines through with an impressive average Google Trends score of 79.3 out of 100 — 28.6% higher than the study’s average (61.7).
Indulging in a weekly taco feast won’t put a strain on your wallet in Houston either. The average cost is a pocket-friendly $20.69 — 15% lower than the study’s average ($24.28).
» Best Places for Tacos in Houston: El Taconazo and Fonda Santa Rosa
11. Salt Lake City, UT
🤑 Tasty Savings
It pays to live in Salt Lake City as a taco lover! In SLC, preparing tacos at home once per week costs the median household just 1.3% of their annual income, 22% less than the average city in our study (1.7%).
The Salt Lake City taco scene is firing on all cylinders. With an impressive 2.9 taco restaurants per 100,000 residents, this city surpasses the average by 27.4%, bringing the flavor in full force. Salt Lake City’s taco enthusiasm reaches new heights with an average Google Trends score of 71.6 out of 100, a mouthwatering 16% higher than the average city in our study.
But that’s not all. Tacos really are more affordable in SLC in many ways. The average cost of making tacos once a week each month in Salt Lake City rings in at a wallet-friendly $20.28, 17% lower than the study’s average ($24.28).
» Best Places for Tacos in Salt Lake City: TACOnTENTO and Don Joaquín
12. Oklahoma City, OK
🌮 Taco-ver the moon
Folks in Oklahoma City don’t have to journey far for tacos. OKC has 3.7 taco restaurants per 100,000 residents, 60% more than the average city in our study (2.3).
Oklahoma City is passionate about tacos. With an impressive average Google Trends score of 69.2 out of 100, this city’s taco enthusiasm shines, surpassing the national average (61.7) by 12.1%. In fact, Oklahoma City is the most passionate city for “taquerias.”
Oklahoma City also takes its tacos seriously, with 3.8% of all restaurants dedicated to tacos, a remarkable 39% higher than the average city in our study (2.7%). It’s also an affordable place to be a taco lover. It will only cost an average of $19.99 to make tacos each week for a month, a wallet-friendly 18% lower than the study’s average ($24.28).
» Best Places for Tacos in Oklahoma City: Trompudos Tacos and Taco Nation
13. Sacramento, CA
🌟 Top Notch Tacos
Sacramento has tacos that will make you shout, “Olé!” Taco joints in Sacramento have an average Yelp rating of 4.34, 7% higher than the average city in our study (4.07).
We’ll soon have to start calling Sacramento the City of Tacos rather than the City of Trees. Sacramento has an impressive 0.06 taco restaurants per square mile, 259% more than the average city in our study (0.017).
With an average Google Trends score of 75.3 out of 100, Sacramento takes taco enthusiasm to new heights, soaring 22% higher than the study’s average (61.7). Sacramento also brings the heat with a remarkable 5% of all restaurants dedicated to tacos, 68% more than the average city in our study (2.7%).
» Best Places for Tacos in Sacramento: Tacoa and Tacos el Alebrije
14. Milwaukee, WI
🏅 Milwaukee’s Cheapest
In Milwaukee, $18.67 is the average cost to make tacos once per week each month. That’s 23% less than the average cost among all cities in our study ($24.28).
Milwaukee not only offers a delectable taco experience, but it also keeps your wallet happy. Preparing tacos at home once per week costs the median household a mere 1.4% of its annual income, 16% less than the average city in our study (1.7%).
But that’s not all. Milwaukee’s taco enthusiasm shines through with an average Google Trends score of 69.2 out of 100, surpassing the study’s average (61.7) by an exciting 12%. Prost!
» Best Places for Tacos in Milwaukee: Jose’s Blue Sombrero and Chucho’s Red Tacos
15. Richmond, VA
💰 Virginia is for savers
In Richmond, preparing tacos at home once per week costs the median household 1.3% of its annual income, 22% less than the average city in our study (1.7%).
When we say Virginia is for savers, we mean it! In Richmond, $18.33 is the average cost to make tacos once per week each month, 25% lower than the average city in our study ($24.28).
Virginians also seem particularly fond of shrimp tacos. Richmond ranks No. 2 for shrimp tacos, just behind Virginia Beach at No. 1, according to Google Trends data.
» Best Places for Tacos in Richmond: El Chido and Big Chile
Best Taco Cities by Category
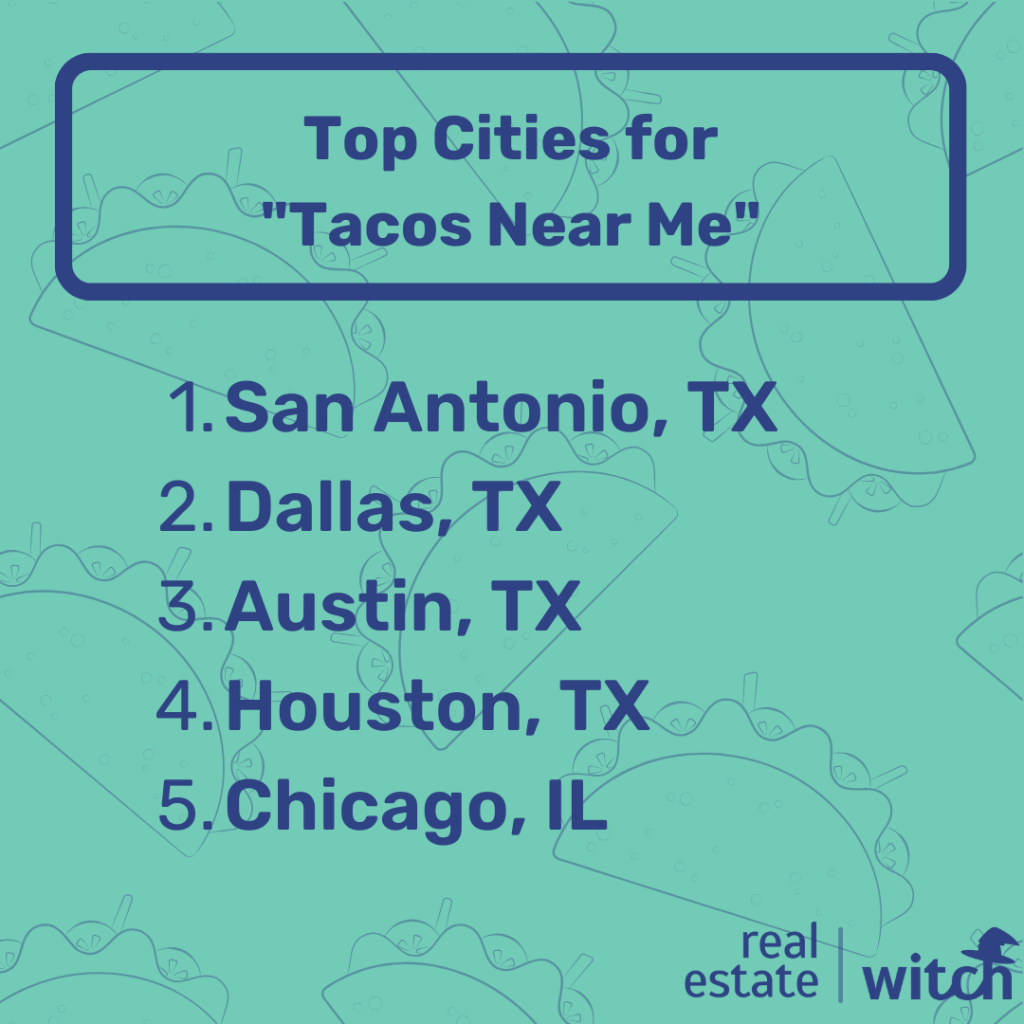
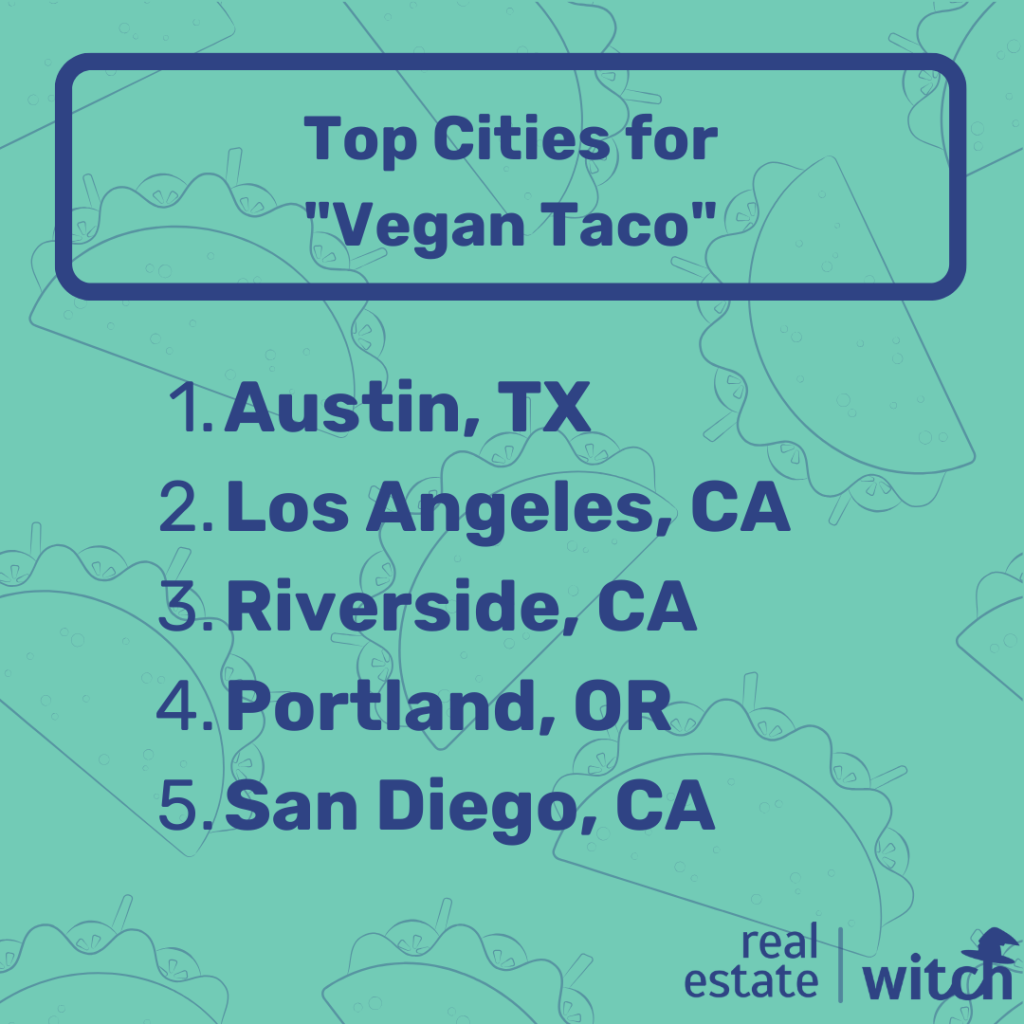
We used Google Trends data for 23 taco-related terms, such as “tacos” and “tacos near me,” to measure each city’s overall “taco passion.” The most passionate taco cities by term are:
Worst Taco Cities
Not every place can be a taco lover’s utopia. Here are the 10 worst cities for tacos in America:
- Cleveland, Ohio
- Boston, Massachusetts
- Pittsburgh, Pennsylvania
- Hartford, Connecticut
- New York, New York
- Miami, Florida
- Philadelphia, Pennsylvania
- Memphis, Tennessee
- Detroit, Michigan
- Jacksonville, Florida
The bottom 10 cities in our study aren’t great for taco lovers because of limited options and high prices. On average, these cities have only 0.88 taco restaurants per 100,000 people, which is 61% fewer than the average city in our study (2.3). Furthermore, taco supplies for three to four people tend to be more expensive in these cities, costing an average of $26.40, or 9% more than the average city ($24.28).
When it comes to taco havens, our worst taco city, Cleveland, falls drastically short. With a meager 1 taco restaurant per 100,000 residents, Cleveland lags behind the average city in our study (2.3) by a staggering 56%. Folks in Cleveland also have to travel farther than other Americans to even find a taco spot. Cleveland manages a mere 0.001 taco restaurants per square mile, a striking 91% fewer than the national average (0.017).
Methodology
Real Estate Witch compared the 50 most populous U.S. metro areas across seven metrics, listed below. Each metric was normalized and graded on a 100-point scale. The combined weighted average of each score determined the overall “taco city” score upon which the final ranking was based.
The metrics used are as follows:
- The number of taco restaurants per 100,000 residents (28.6%)
- The average Yelp star rating of taco restaurants (19.0%)
- The cost of making tacos once a week for a year as a percentage of median household income (14.3%)
- Average price of an assortment of taco foods in each metro (14.3%)
- The average number of taco restaurants per square mile (9.5%)
- Google Trends popularity for 23 different taco-related terms (9.5%)
- The percentage of restaurants that are taco restaurants (4.8%)
Sources: U.S. Census, U.S. Bureau of Labor Statistics, Yelp, Numbeo, and Google Trends.
About Real Estate Witch
You shouldn’t need a crystal ball or magical powers to understand real estate. Since 2016, Real Estate Witch has demystified real estate through in-depth guides, honest company reviews, and data-driven research. In 2020, Real Estate Witch was acquired by Clever Real Estate, a free agent-matching service that has helped consumers save more than $160 million on realtor fees. Real Estate Witch’s research has been featured in CNBC, Yahoo! Finance, Chicago Tribune, Black Enterprise, and more.
More Research from Real Estate Witch
Articles You Might Like
Frequently Asked Questions
Which city in Texas has the best tacos?
Austin has the best tacos in Texas, according to Yelp reviews! Austin has an average Yelp rating of 4.31 — 6% higher than the average city in our study (4.07). Learn more.
Which city has the best tacos?
Las Vegas has the best tacos in America based on Yelp reviews. Taco spots in Las Vegas have an average Yelp rating of 4.36 — 7% higher than the average city in our study (4.07). Learn more.
Which city in California has the best tacos?
Sacramento, California, has the best tacos in California based on average Yelp reviews for taco spots. Sacramento's average rating for taco places is 4.34 — 7% higher than the average city in our study (4.07). Learn more.
Does NYC have good tacos?
Based on our research, New York came in 46th place in our study of the best cities for tacos. New York taco spots average a Yelp rating of 4.23, which is 4% higher than the national average (4.07) but still 15th place overall for Yelp ratings. Learn more.

Leave a Reply